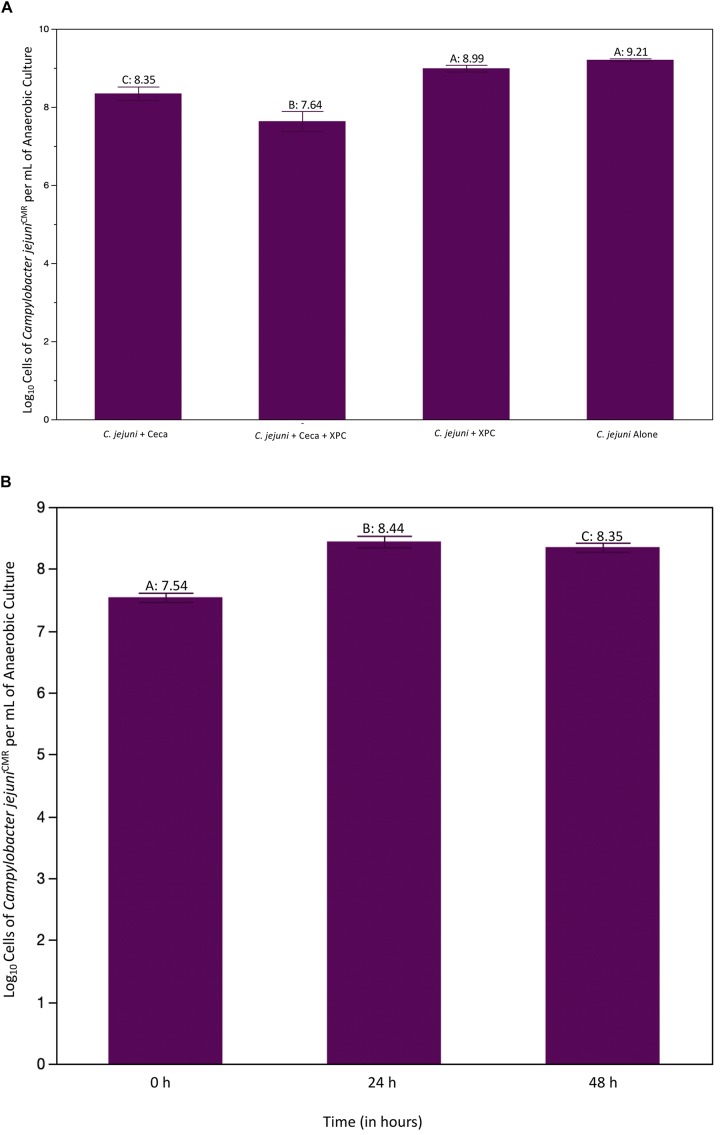
FIGURE 2.
(A) Recovered log cells of Campylobacter jejuni per mL of ceca culture at 24 h. Ceca were aseptically harvested from 41 day old Cobb 500 male broilers for Trial 1. All comparisons were made against C. jejuni in Bolton’s broth only using Dunnet’s Test for multiple comparisons. The bars represent the standard error of the sample mean. Each different letter indicates statistical significance and each number represents the mean Log10 CFU recovery of Campylobacter (P < 0.05). (B) Log cells of C. jejuni per mL of cecal culture recovered over time. C. jejuni were isolate at 0, 24, and 48 h and quantified using a Petroff–Hausser counter. The purple line is the CON group, the aqua line is the XPC treated group. There were significant effects of treatment and time as compared to the CON at 0 h group. There were no differences in XPC and CON at 0 h, therefore all differences are theorized to emerge due to treatment effects.

