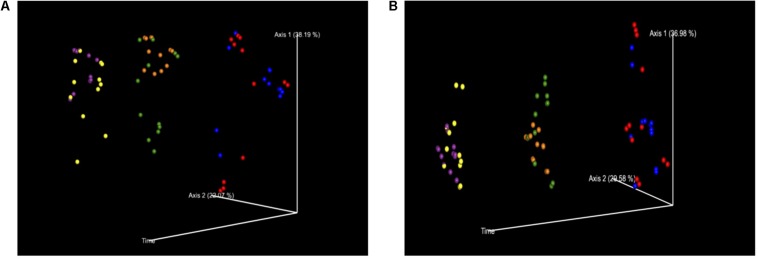
FIGURE 4.
(A) PCoA of Bray–Curtis Diversity Index separated out by time. Time was a significant factor in the change in diversification and therefore the treatment groups were plotted against the variable of time. Key: Red: 0 h; CON: Blue; 0 h XPC: Orange: 24 h CON; Green: 24 h XPC; Purple: 48 h CON; Yellow 48 h XPC. (B) PCoA of Weighted Unifrac Diversity Index Separated Out By Time. Time was a significant factor in the change in diversification and therefore the treatment groups were plotted against the variable of time. Key: Red: 0 h; CON: Blue; 0 h XPC: Orange: 24 h CON; Green: 24 h XPC; Purple: 48 h CON; Yellow 48 h XPC.

