FIGURE 5.

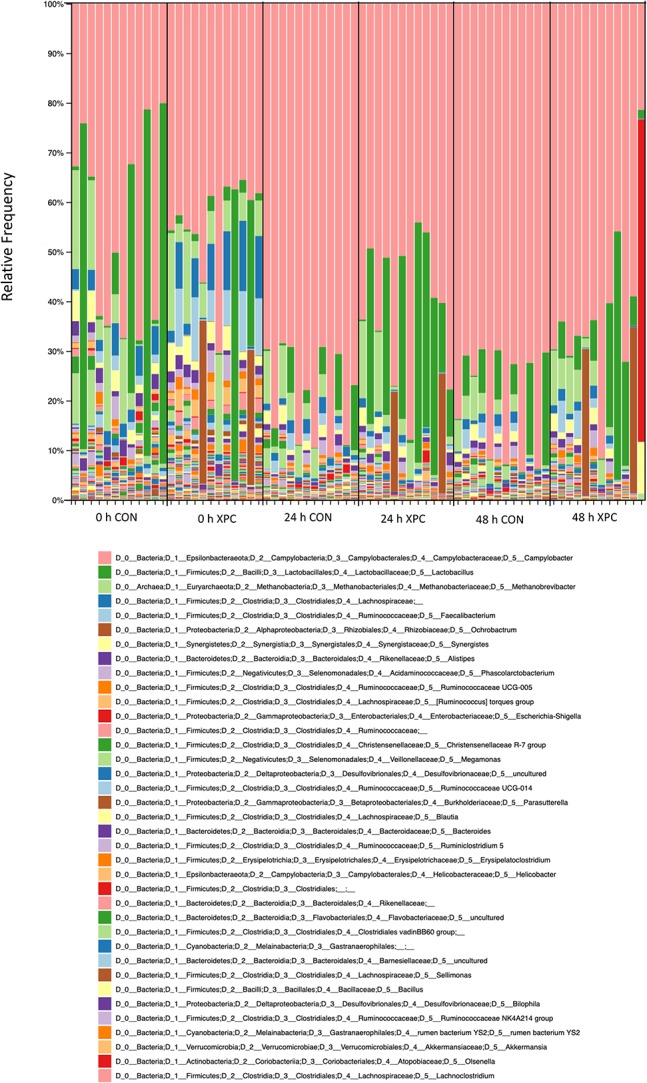
Taxonomical bar graphs. Taxonomy bar plots are visualized through the species epithet and the colors are presented from the top of the graph (coral, Campylobacter) to the bottom of the graph (coral, Lachnoclostridium).

Taxonomical bar graphs. Taxonomy bar plots are visualized through the species epithet and the colors are presented from the top of the graph (coral, Campylobacter) to the bottom of the graph (coral, Lachnoclostridium).