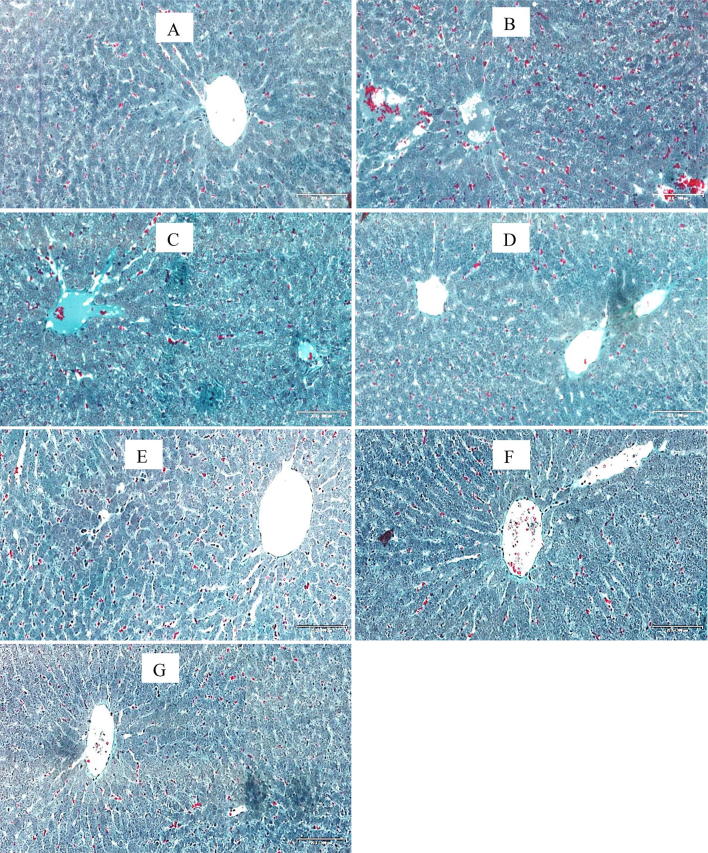
Fig. 3.
Photomicrographs of liver sections (MT stains). Scale bar 20 × 200 μm. Note the normal architecture of the liver with intact hepatocytes stained red in groups A, D, E, F and G. Nuclei can be seen as dark red to black structures within cells and fibrous elements stained light blue. There is extensive necrosis of central veins, hepatic cords and massive fibrosis in groups B, and C. a –ve Control, b Diabetic +ve Control c Diabetic + HAART d Diabetic + M. charantia 200 mg/kg e Diabetic + M. charantia 400 mg/kg, f Diabetic + M. charantia 200 mg/kg + HAART g Diabetic + M. charantia 400 mg/kg + HAART

