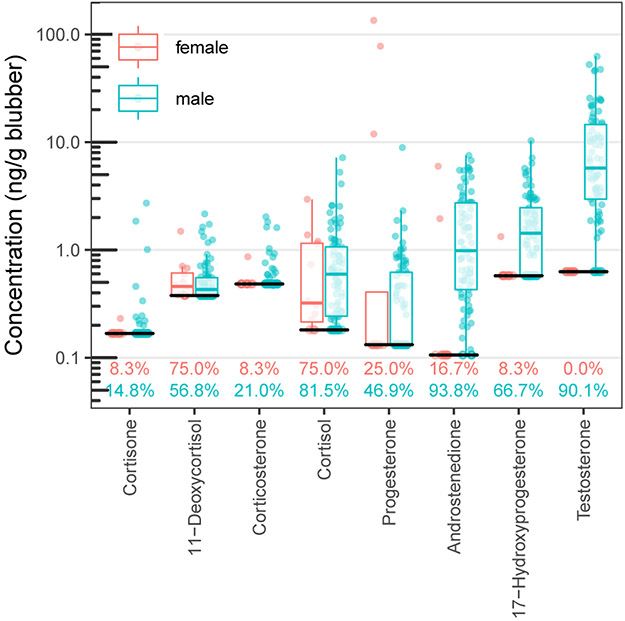
Figure 2:
Boxplots of blubber hormone concentrations from all common bottlenose dolphins sampled in this study on the Ashepoo, Combahee, Edisto Basin and surrounding Charleston-area waterways in South Carolina. Boxplots represent the median with quartiles. The lower solid black bar represents the reporting limit for this method. Detection frequencies for each hormone are listed by sex above the x-axis.

