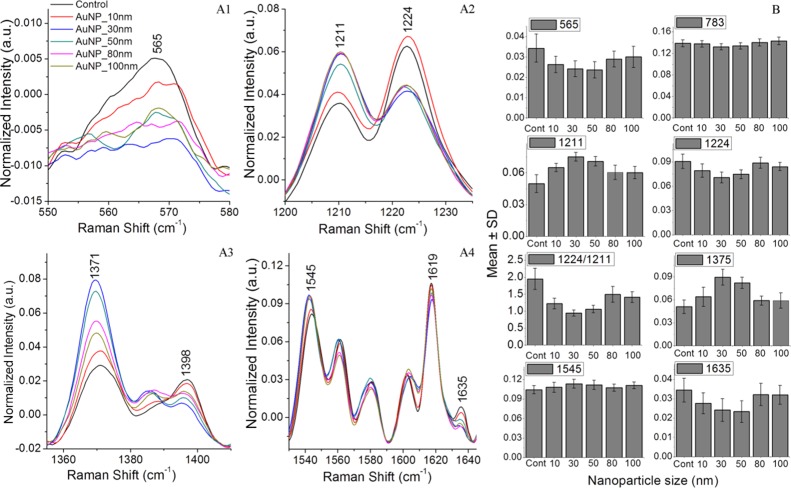
Figure 6.
(A1–A4)—Mean Raman spectra from normal RBCs and RBCs treated with gold nanoparticles of average sizes 10, 30, 50, 80, and 100 nm shown in the region where maximum spectral variations are observed. (B)—Mean value of various peaks is plotted for control RBCs and RBCs treated with gold nanoparticles.

