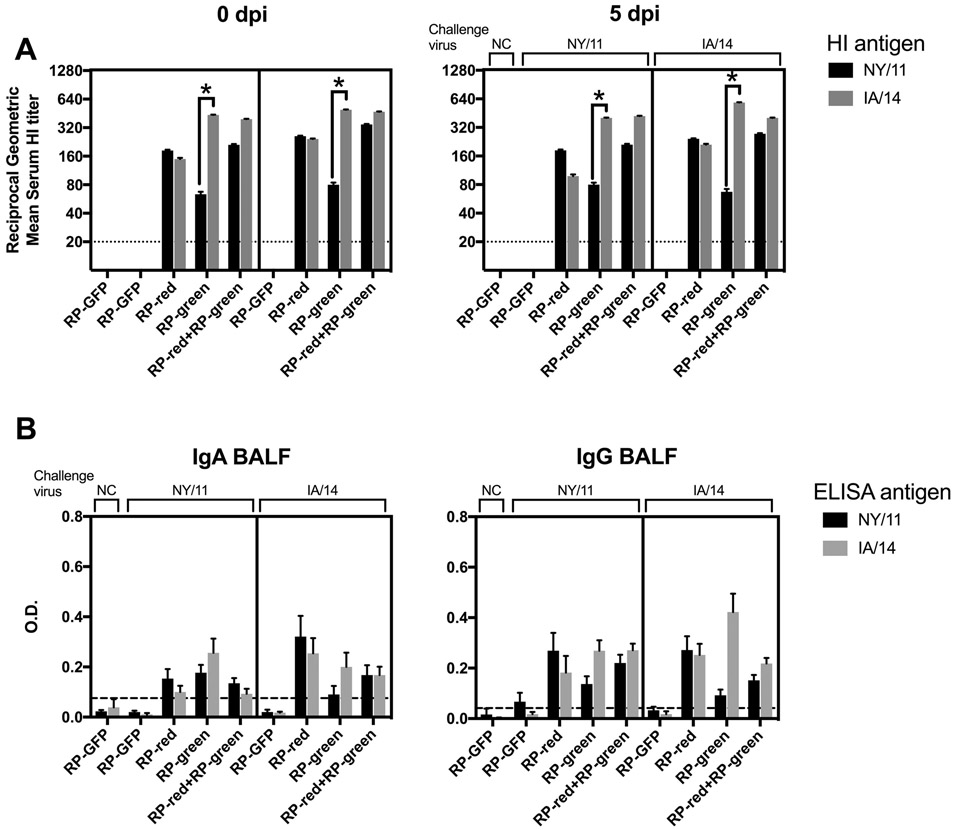
Fig. 1. Antibody responses in pigs against NY/11 and IA/14 induced by monovalent and bivalent RP vaccines pre- and post-infection.
(A) Serum hemagglutination inhibition (HI) geometric mean titers against IA/14 and NY/11 at 0 and 5 dpi from all vaccinated groups and the sham vaccinated pigs (RP-GFP). (B) Whole virus IgA and IgG ELISA’s were performed using BALF from 5 dpi with IA/14 and NY/11 as antigens. Groups of pigs are labeled according to vaccine use. HI titers that differed by more than two serial dilutions within 0 or 5 dpi are marked with an asterisk (A). Data presented as mean optical density (O.D.) or geometric mean titers ± standard error of the mean. Cut-off values (dotted line) for ELISA data was calculated as the mean of blank wells plus three times the standard deviation. A black line within each graph separates groups according to challenge strain (NY/11 on the left, IA/14 on the right).

