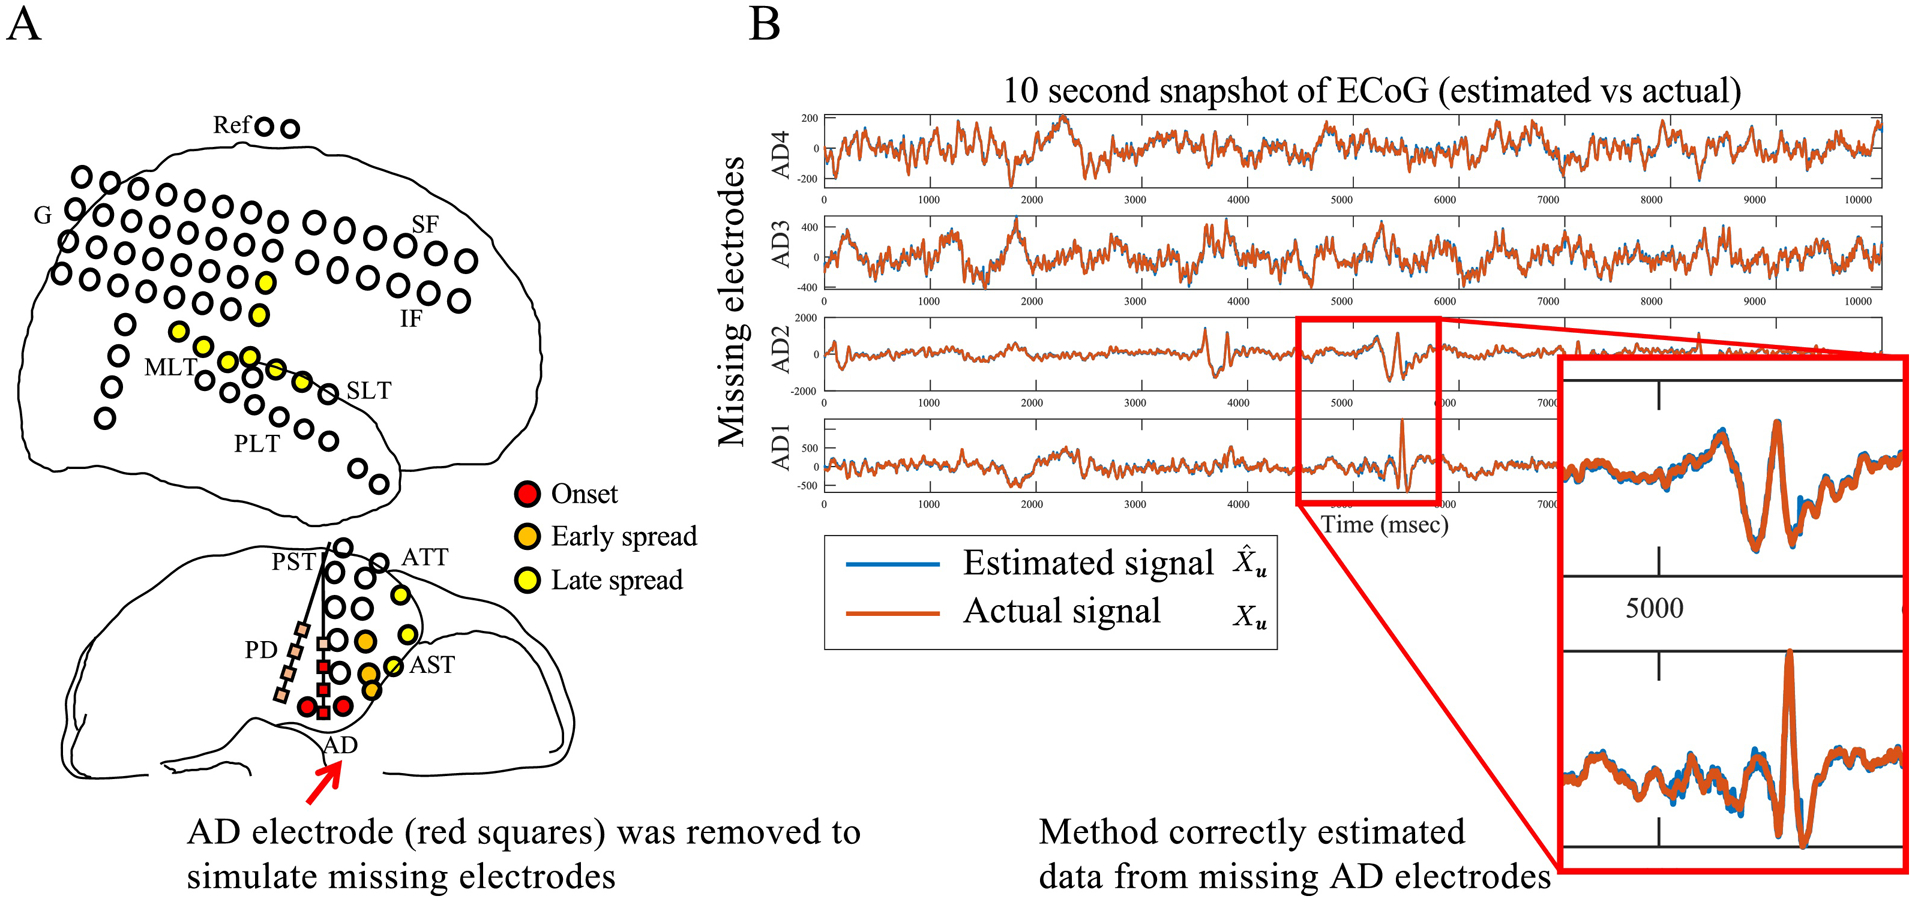
Figure 4: Estimating signals of missing electrodes.

A) ECoG implantation for patient. B) 10 second snapshot of actual (red) versus estimated (blue) signals of 4 missing contacts from one depth electrode. Two contacts were clinically labeled as early onset zone because of spikes highlighted in zoom-in panel shown. Note that no spikes were visible in all other signals, demonstrating that with knowledge of network model, the observer is able to very accurately reconstruct missing contact signals, including important spike events.
