
Figure 5: Graph theory to estimate different responses to electrical stimulation.
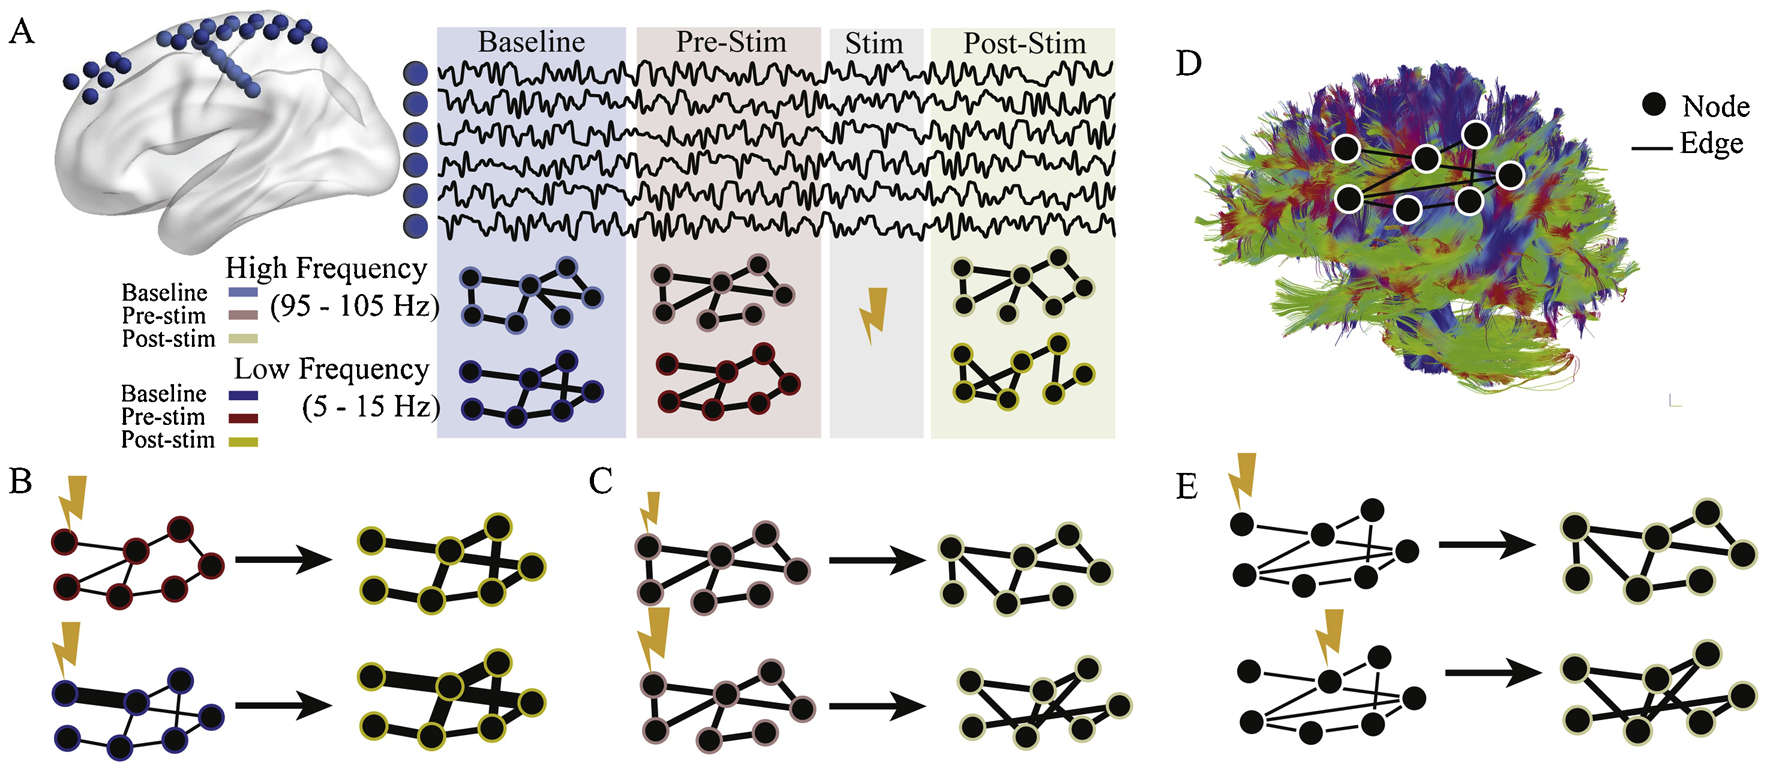
(A) Methods and experimental design. 94 individuals with implanted intracranial EEG electrodes (blue spheres) voluntarily participated in a stimulation regimen. Each subject had baseline (blue) recording with no stimulation, followed by several stimulation trials, with pre- (red) and post-stimulation (yellow) epochs. For each of these epochs, functional networks were constructed by calculating multi-taper coherence between all electrodes in one of four frequency bands (5–15 Hz, 15–25 Hz, 30–40Hz, or 95–105 Hz). Only two are shown for simplicity. (B, top) In low frequencies (5–15 Hz), the node strengths, or sum of connection weights, increase between pre- and post-stimulation epochs. (B, bottom) Nodes with high baseline coherence to the stimulated region have larger increases in strength. (C) In high frequencies (95–105 Hz), the pattern of edge similarity changes with stimulation. This change is larger for stimulation with higher frequency (bottom). (D) An example of a structural brain network obtained with DWI, where edges are proportional to the density of white matter connections between regions. (E) When stimulating structural nodes that are weakly connected (top), functional connectivity patterns of the high frequency band undergo less reorganization than when stimulating structural nodes that are strongly connected (bottom).