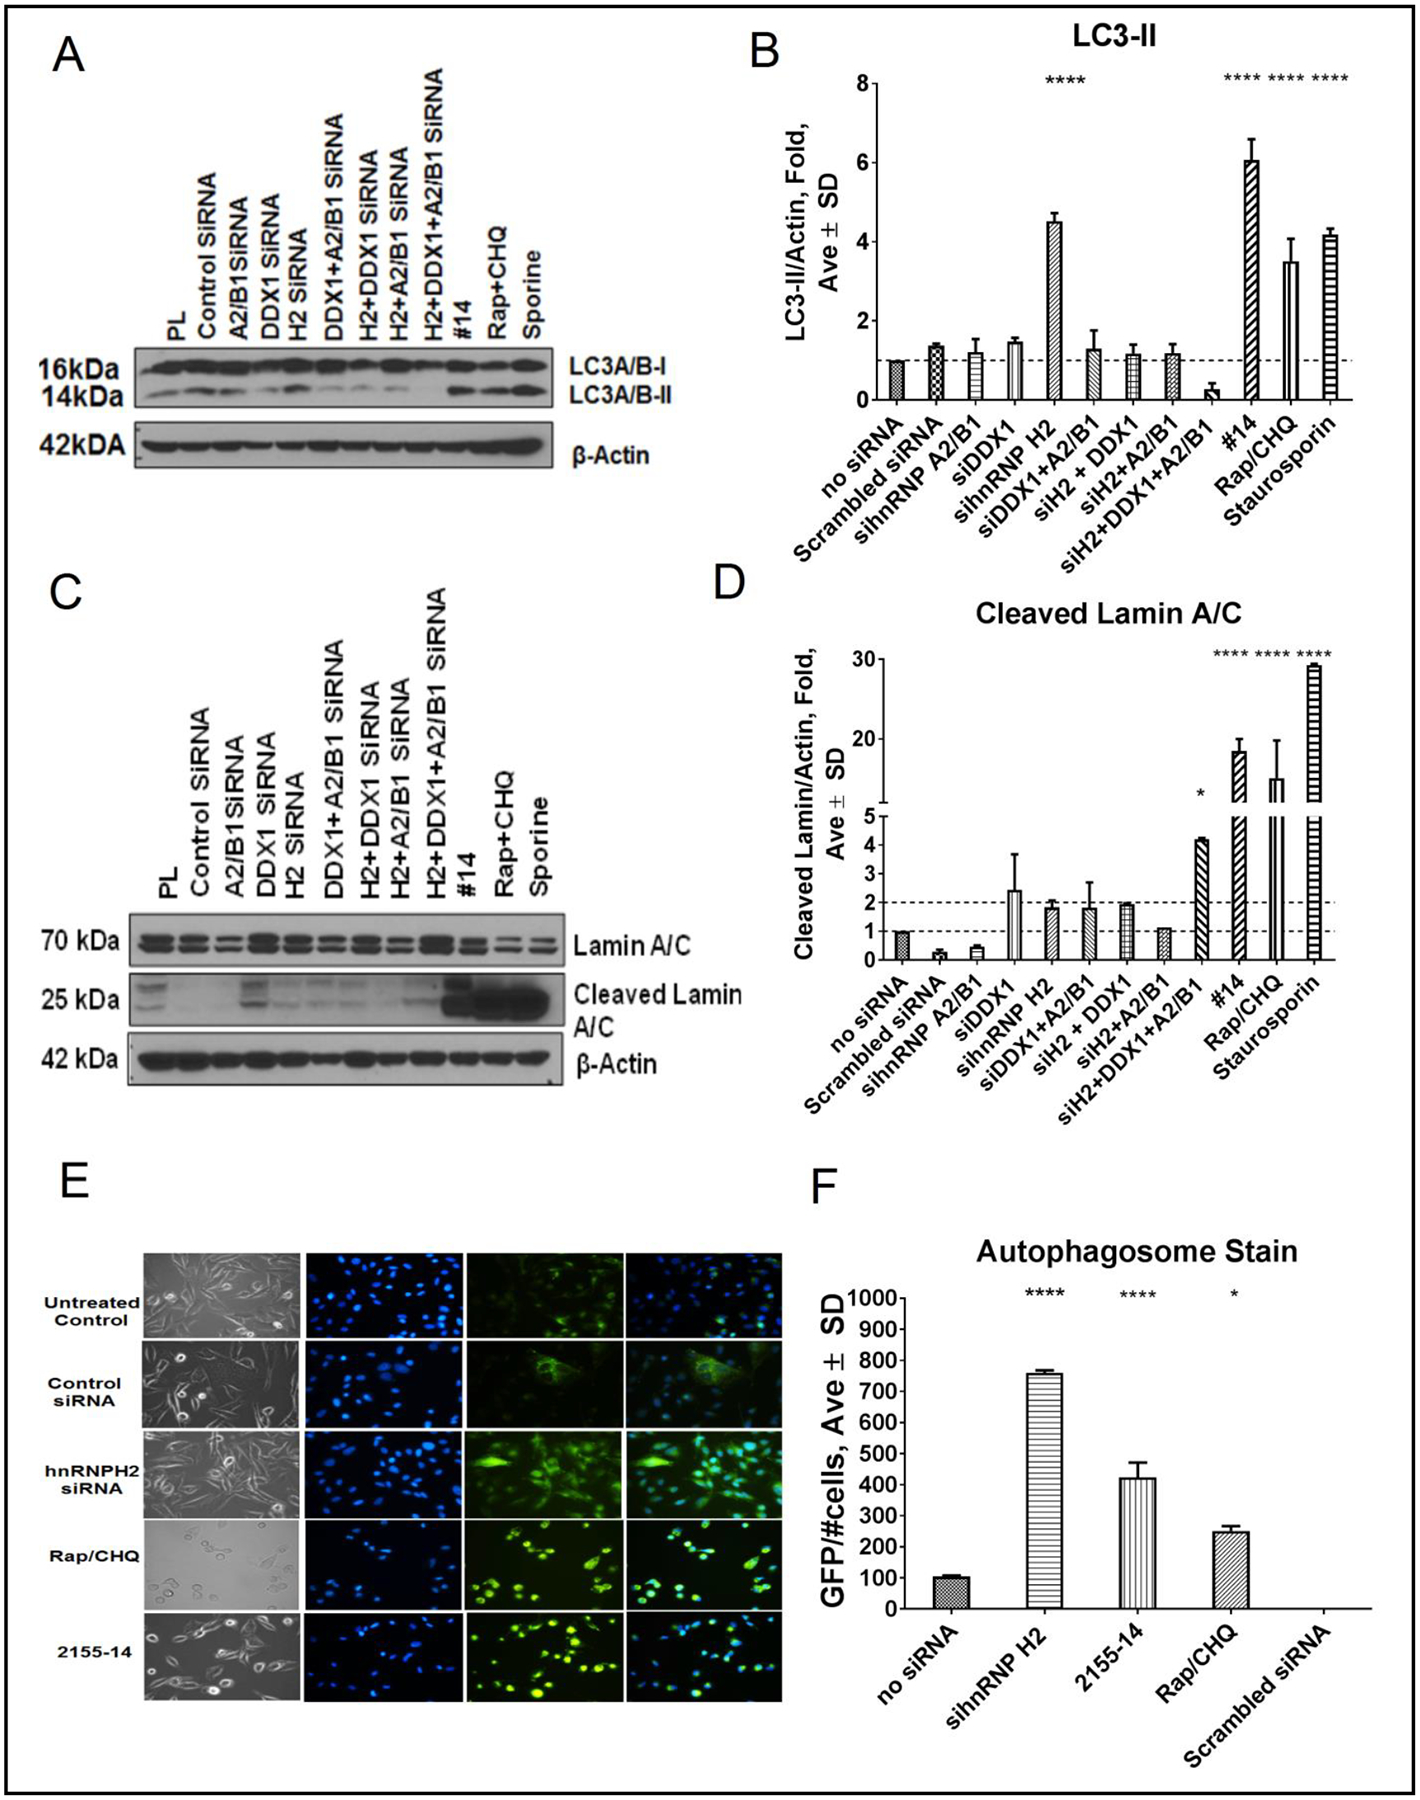
Fig. 10.

Effect of siRNA knockdown on LC3-II and lamin A/C levels. (A) Representative western blot of LC3-II in WM266–4 lysates in response to siRNA treatment and (B) its quantification. (C) Representative western blot of lamin A/C in WM266–4 lysates in response to siRNA treatment and (D) its quantification. (E) WM266–4 cells showed increased autophagosome staining at 24 h after addition of hnRNP H2 siRNA and 2155–14. Nuclei are stained blue. (F) Autophagy (GFP) channel was used to quantify positive WM266–4 cells. Number of cells present in each well was normalized using DAPI-stained nuclei. One-way analysis of variance (ANOVA) was used followed by Sidak multiple comparisons test. The data shown were the mean ± SD, n=3. ***** - p<0.0001, *** - p<0.001, ** - p<0.01, * - p<0.05, rest = no significance.
