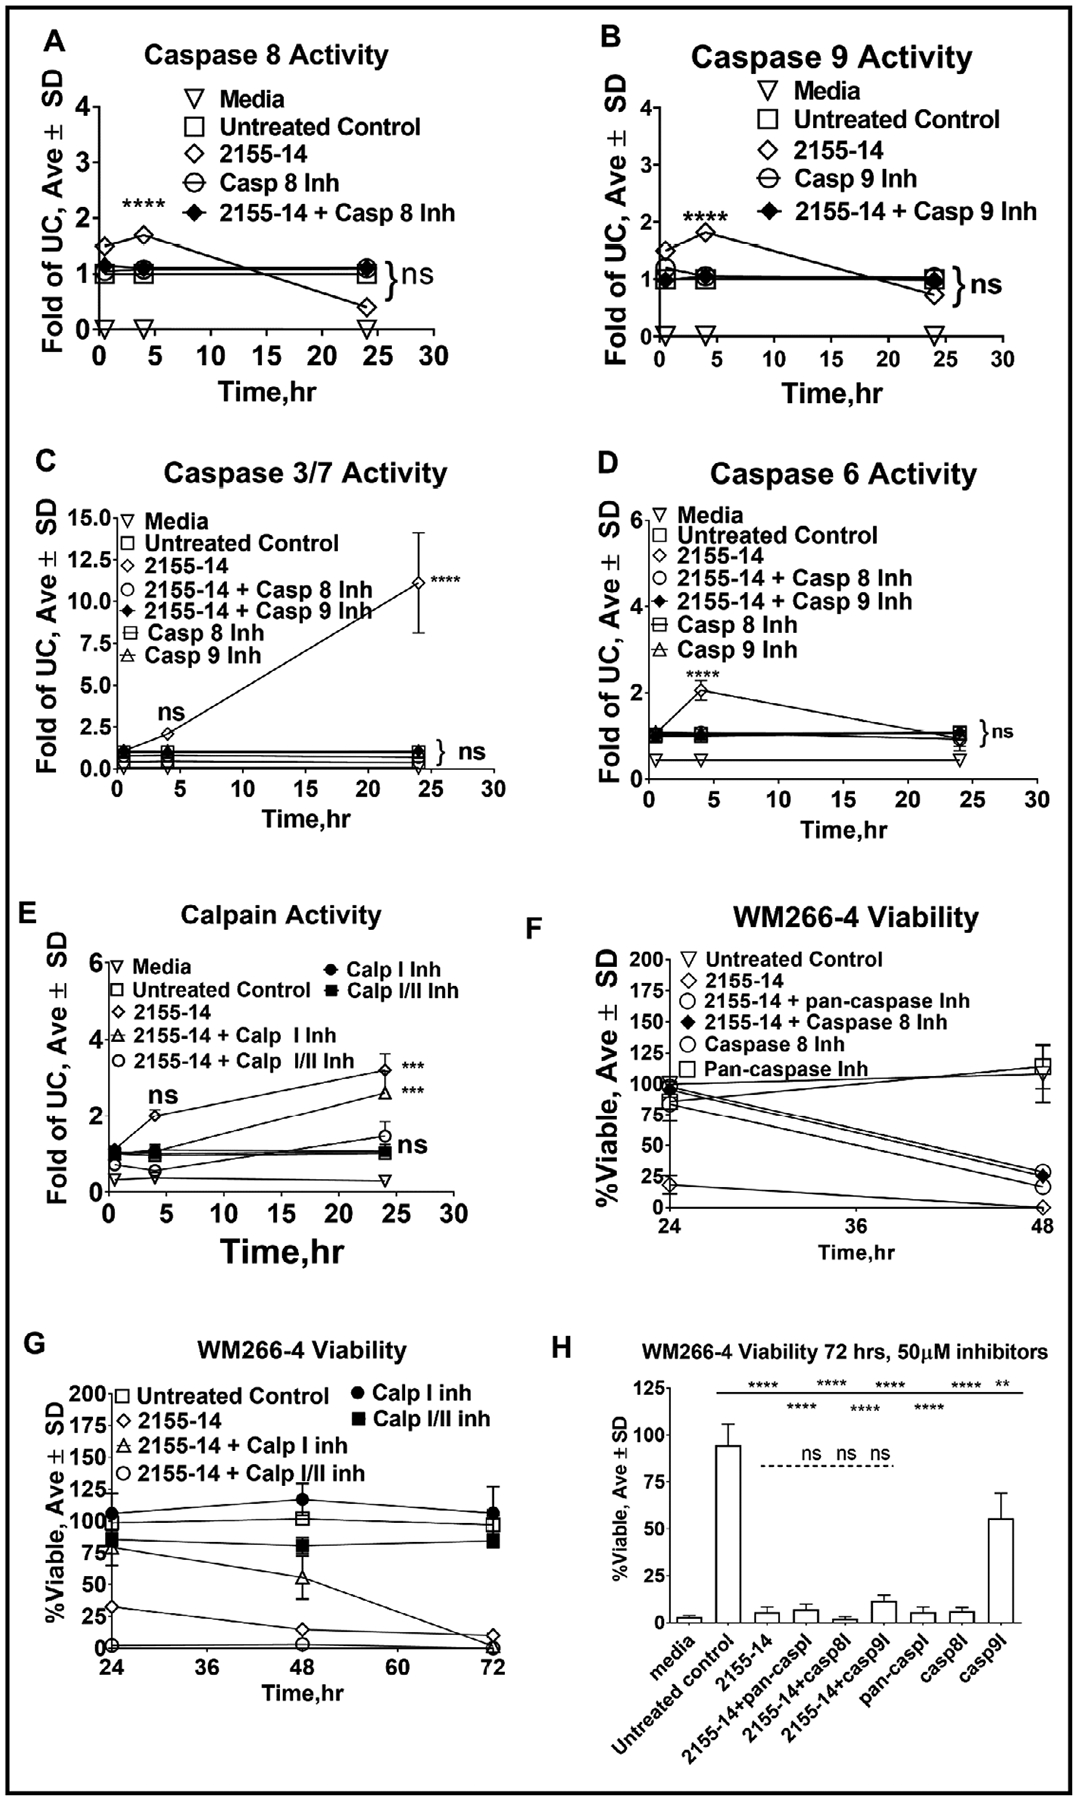
Fig. 12.

Effect of 2155–14 on caspase and calpain activity and its inhibition on viability of WM266–4 cells. (A) Caspase 8 activity assay results. (B) Caspase 9 activity assay results. (C) Caspase 3/7 activity assay results. (D) Caspase 6 activity assay results. (E) Calpain I/II activity assay results. (F) Cell viability time course after pre-treatment with 10 μM caspase inhibitors. (G) Cell viability time course after pretreatment with 25 μM calpain inhibitors. (H) Cell viability 72 h after pre-treatment with 50 μM caspase inhibitors. One-way analysis of variance (ANOVA) was used followed by Dunnett post hoc test. The data shown were the mean ± SD, n=6. ***** - p<0.0001, *** - p<0.001, ** - p<0.01, * - p<0.05, ns – no significance; 2155–14 was tested at 100 μM.
