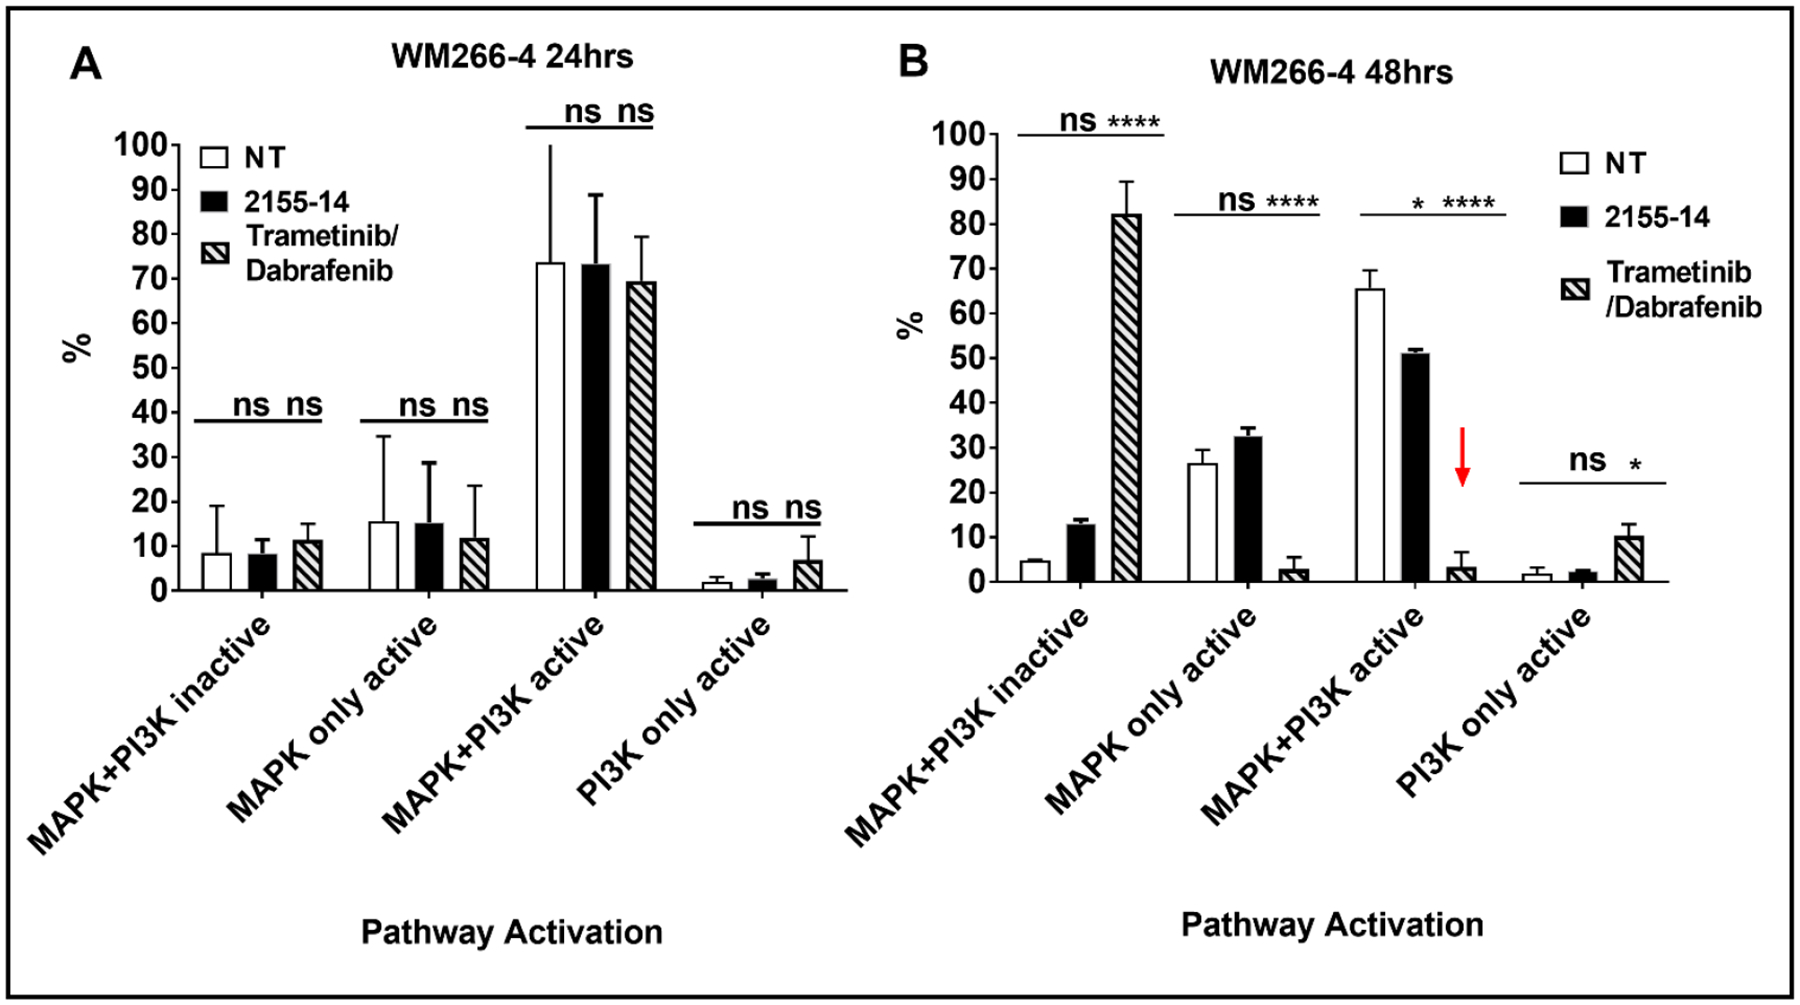
Fig. 6.

Results of flow cytometry-based assay of MAPK and PI3K pathway activation of WM266–4 cells in presence of 2155–14. (A). 24 h treatment with 100 μM 2155–14. (B) 48 h treatment with 100 μM 2155–14. One-way analysis of variance (ANOVA) was used followed by Dunnett post hoc test. The data shown were the mean ± SD, n=3. ***** - p<0.0001, ns – no significance; 2155–14 Trametinib/dabrafenib combination was tested at 25 μM of each compound. MAPK+PI3K inactive – cell population with neither MAPK nor PI3K pathway activated; MAPK only active - cell population with just MAPK pathway activated; MAPK+PI3K active - cell population with both MAPK and PI3K pathways activated; PI3K only active - cell population with just PI3K pathway activated.
