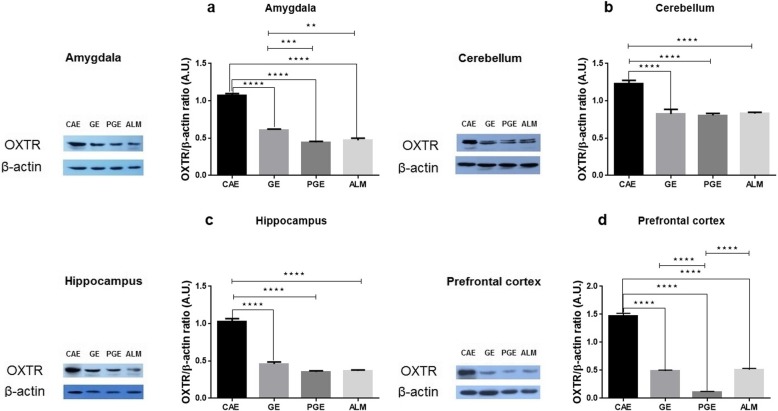
Fig. 7.
OXTR levels after prenatal and early–life exposure of the CAE, GE, PGE, and ALM rats in the a amygdala (N = 4, Three times repetition), b cerebellum (N = 4, Three times repetition), c hippocampus (N = 4, Three times repetition), and d prefrontal cortex (N = 4, Three times repetition). Error bars represent the SEM. *p < 0.05, **p < 0.01, ***p < 0.001, ****p < 0.0001; one-way ANOVA with Tukey ˀs multiple comparisons)

