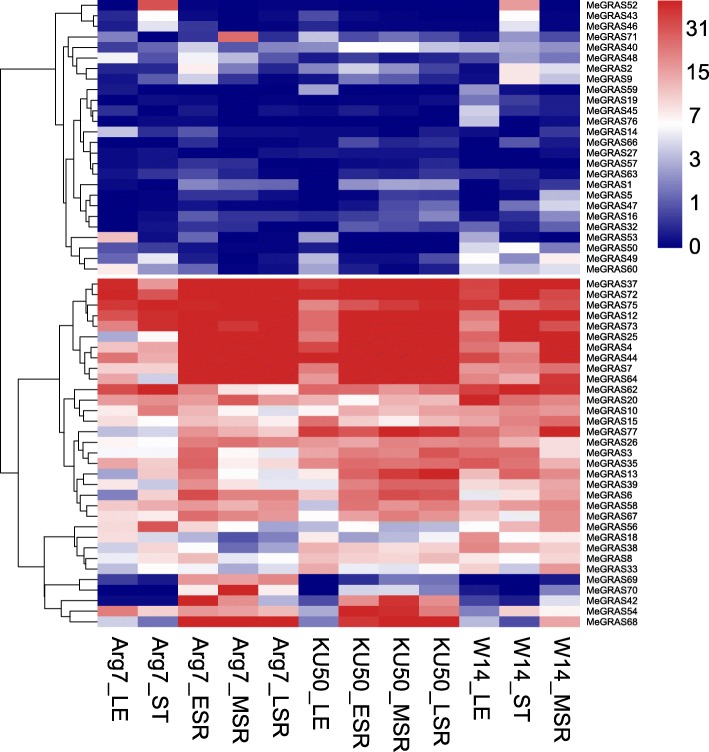
Fig. 6.
Expression profiles of MeGRAS genes in different tissues of three cassava varieties. LE, ST, ESR, MSR, and LSR represent leaves, stems, early-storage roots, middle-storage roots, and late-storage roots, respectively. FPKM values were used to generate the heat map with clustering. The scale represents the relative signal intensity of the FPKM values

