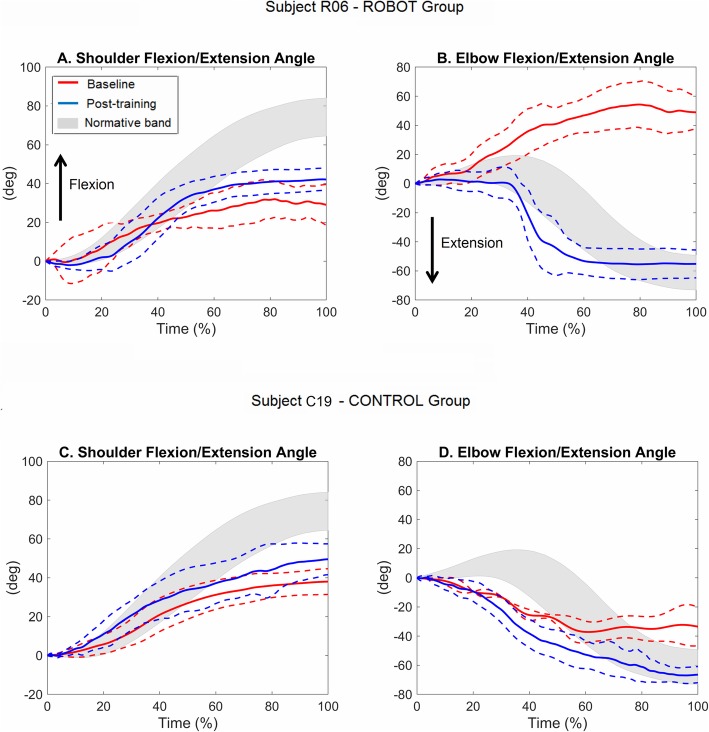
Fig. 5.
Example of temporal profiles (within-subject mean ± standard deviation curves) of shoulder (a, c) and elbow (b, d) flexion/extension angles during the “move-and-place” test executed pre- (red lines) and post-training (blue lines) by two participants post-stroke from the ROBOT group (participant R06, upper panels) and the CONTROL group (participant C19, lower panels). Gray bands represent the healthy subjects mean ± standard deviation curve. All curves are reported after subtraction of the initial values

