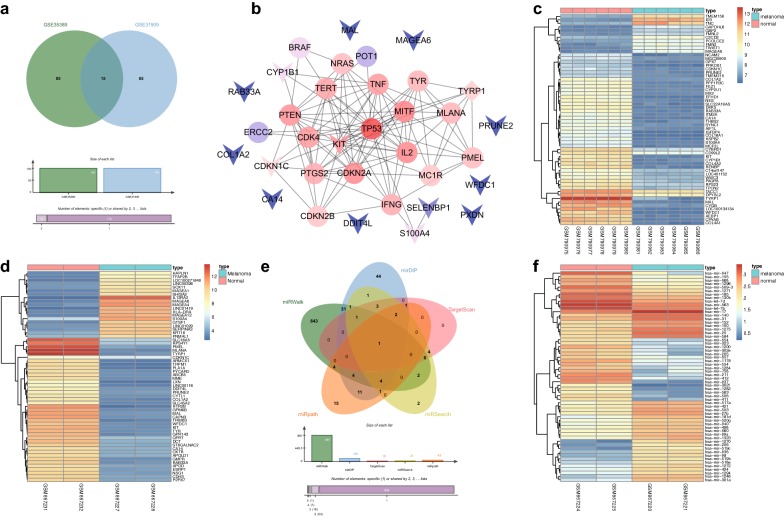
Fig. 1.
The significance of miR-517a in melanoma. a Comparison in the top 100 DEGs from the GSE31909 and GSE35389-mRNA datasets. b the PPI network between DEGs and melanoma genes. The arrow represents DEGs, the circle represents the melanoma genes, and the diamond represents the melanoma genes with differential expression. c, d The heat maps of the top 60 DEGs related to melanoma from the GSE31909 and GSE35389-mRNA microarray data, respectively; the abscissa refers to the sample number, and the ordinate refers to the names of DEGs. The upper right histogram refers to the color gradation. Each block represents the expression level of a gene in one sample. e Predicted miRNAs regulating CDKN1C by the miRWalk, mirDIP, TargetScan, miRSearch, and miRpath databases; f The heat maps of the top 60 miRNAs with differential expression in GSE35389-miRNA microarray data

