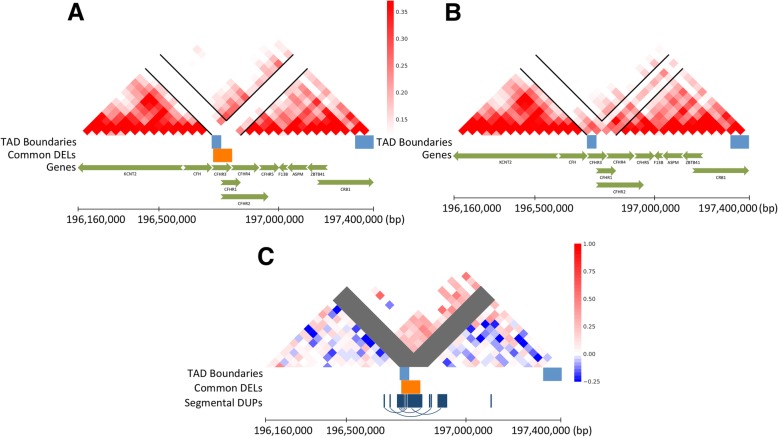
Fig. 1.
Deletion of CFHR3 and CFHR1 is associated with variation in chromatin conformation. Maps of chromatin interaction surrounding an 80 kb deletion of the CFHR3 and CFHR1 genes (hg19 position chr1:196,728,877–196,808,865) are depicted by averaging the counts within the contact matrices of subjects homozygous for the deletion haplotype (N = 3, Panel a) and subjects homozygous for the reference haplotype (N = 12, Panel b). Normalized counts were plotted as a heatmap with red tone representing the number of chromatin interactions in 40 kb bins. To better visualize the effects for this example, the correlation of counts with the deletion haplotype was tested for all bins across a 1.24 Mb region by linear regression, and regression coefficients were displayed as a blue-red heatmap (Panel c)

