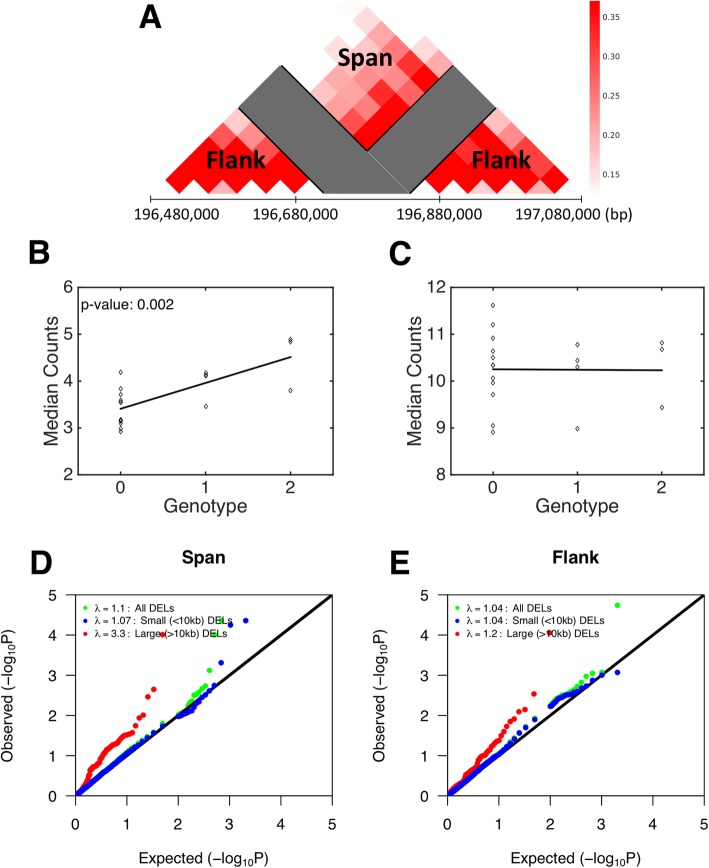
Fig. 2.
Testing the effect of common deletions on chromatin conformation. The Hi-C map of chromatin interactions for the 80 kb CFHR3/1 deletion was separated into regions that interact across the deletion (span) and regions that do not cross the deletion (flank) as they can exhibit different behavior with the removal of the deletion bins (Panel a). The effect of the deletion on chromatin conformation was investigated by linear regression, showing a significant effect in the span region (p-value: 0.002, Panel b) and no effect in the flank region (Panel c). The same analysis was run for all common deletions and p-values stratified by size at a 10 kb threshold were displayed in a QQ plot. Large deletions have the strongest effect in the span region while the contribution from small deletions is non-existent (Panel d). Large deletions show a smaller effect in the flank region (Panel e)

