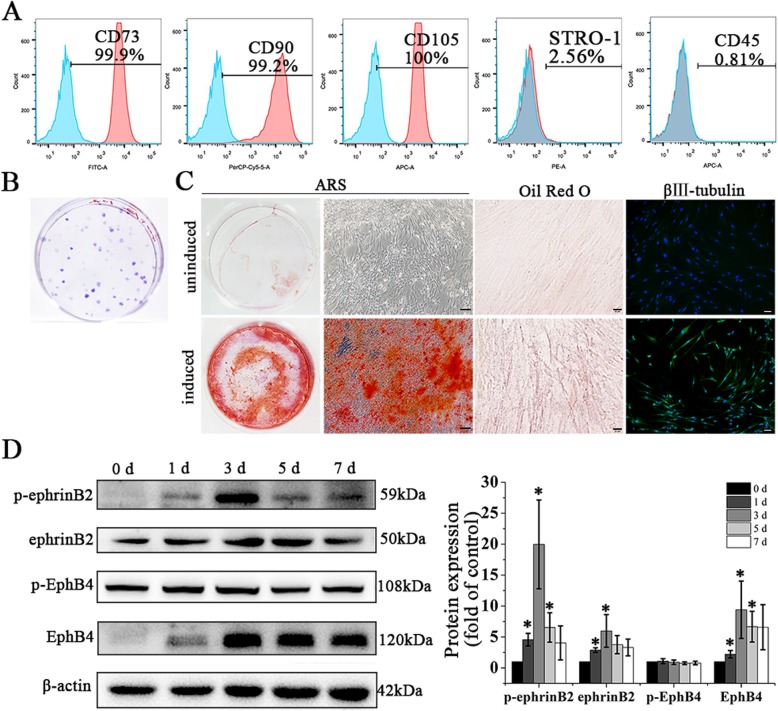
Fig. 1.
Characterization of primary cultured hDPSCs and ephrinB2 expression in hDPSCs during osteogenic differentiation. a Mesenchymal stem cell markers measured by flow cytometry. b Colony-forming units stained with crystal violet. c Osteogenic, adipogenic, and neurogenic potentials of hDPSCs were confirmed by Alizarin Red S staining, Oil Red O staining, and β III -tubulin expression. Scale bar of left and right images, 100 μm; scale bar of middle images, 20 μm. d Expression of p-ephrinB2, ephrinB2, p-EphB4, and EphB4 in hDPSCs during osteogenic differentiation. Protein expression levels were normalized to that of β-actin. Data are shown as mean ± SD. Assays were repeated three times. *p < 0.05 vs. sample on day 0 of osteogenic induction

