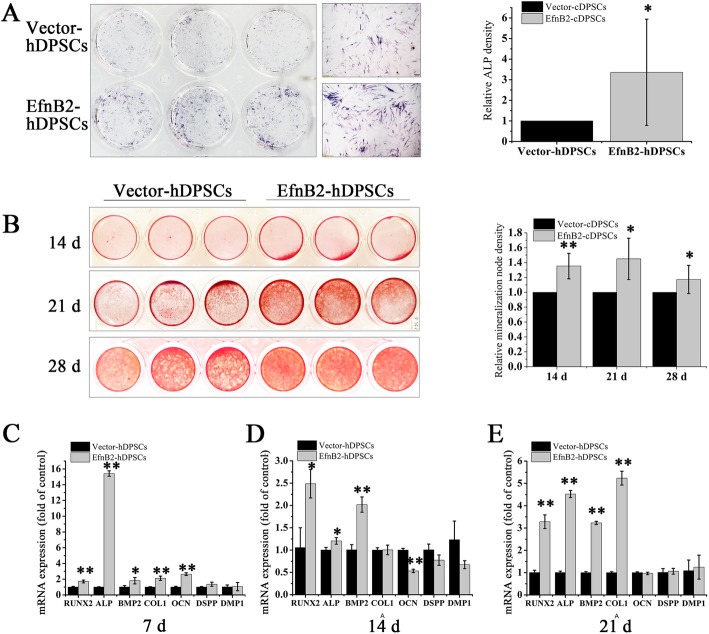
Fig. 3.
The effect of endogenous ephrinB2 overexpression on osteogenic differentiation of hDPSCs. a ALP staining on day 7 of osteogenic differentiation. Scale bar = 200 μm. Staining intensity was quantified with ImageJ. b Alizarin Red S staining on days 14, 21, and 28 of osteogenesis. Staining intensity was quantified with ImageJ. c–e mRNA expression of RUNX2, ALP, BMP2, COL1, OCN, DSPP, and DMP1 in EfnB2-hDPSCs (ephrinB2 overexpression) and Vector-hDPSCs (ephrinB2 overexpression control) after 7, 14, and 21 days of osteogenic induction. Data are shown as mean ± SD. Assays were repeated three times. *p < 0.05 and **p < 0.01 vs. Vector-hDPSCs

