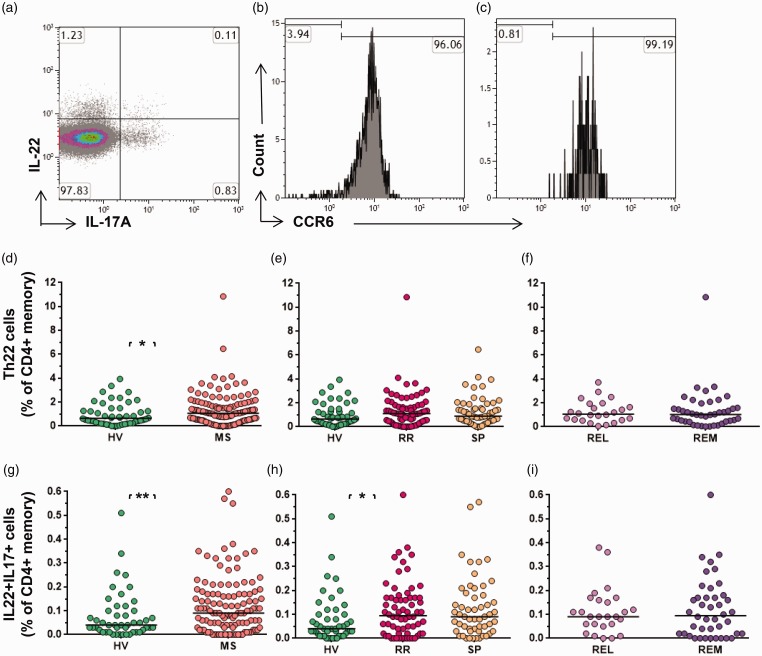
Figure 2.
Th22 and IL-17A+ IL-22+ cells in MS. (a) Representative data demonstrating IL-17A+ and IL-22+ expression (gated on CD4+memory cells). Numbers represent the percentage of cells within the quadrant, with negative gates set based on unstimulated controls. The histograms (b and c) show CCR6 status of IL-22+ cells and IL-17A+ IL-22+ cells, respectively. Th22 as a proportion of CD4+memory cells (d) in MS vs HV, (e) in RRMS vs SPMS and HV, and (f) in relapse vs remission. Dual IL-17A+ IL-22+ cells as a proportion of CD4+memory cells (g) in MS vs HV, (h) in RRMS vs SPMS and HV, and (i) in relapse vs remission. Bars indicate the median value for each group. HV: healthy volunteers; IL: interleukin; MS: multiple sclerosis; REL: relapse; REM: remission; RR: relapsing–remitting multiple sclerosis, SP: secondary progressive multiple sclerosis; Th17: T-helper 17 cell. Mann-Whitney test was performed for comparison of cross data between HV and MS; and between REL and REM. Kruskal-Wallis test was performed for the comparison between HV, RR and SP groups. Bars indicate median values (*p < 0.05, **p < 0.01, ***p < 0.001); all other comparisons were nonsignificant (p > 0.05).

