Figure 3.
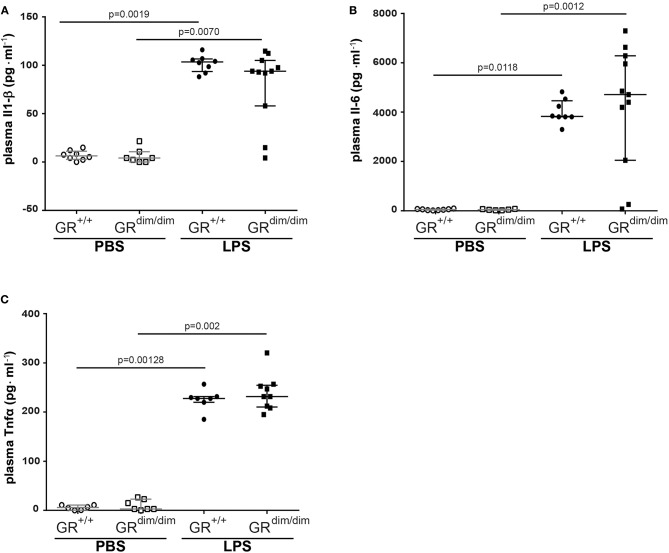
Level of inflammatory cytokines in the plasma. Concentration of (A) interleukin 6 (Il-6), (B) interleukin 1 β (Il-1β), and (C) tumor necrosis factor α (Tnfα) in the plasma of GRdim/dim and GR+/+ mice after an intraperitoneally challenge with lipopolysaccharides (LPS) or treatment with PBS. LPS = lipopolysaccharide from Escherichia coli [055:B5], 10 mg·kg−1, dissolved in 10 μl·g−1 phosphate buffered saline (PBS). GR+/+ mice challenged with PBS: n = 6–8, GRdim/dim mice challenged with PBS: n = 6–7, GR+/+ mice challenged with LPS: n = 7–8, GRdim/dim mice challenged with LPS: n = 9–11. Data is presented as median (25th and 75th percentile and minimum/maximum).

