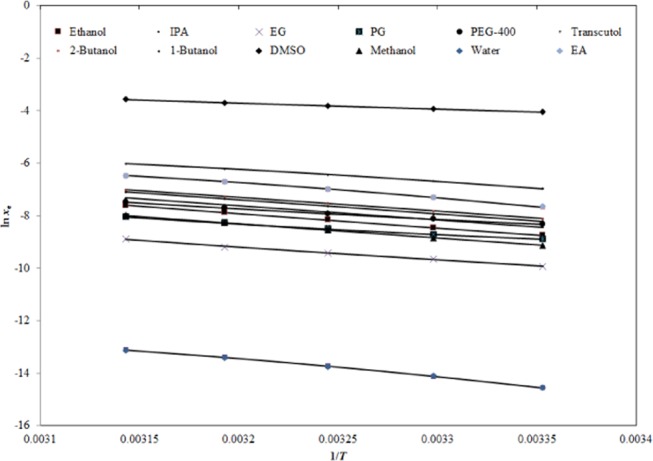
Figure 3.

Correlation of ln xe values of GLZ with Apelblat model in 12 different neat solvents as a function of 1/T; the symbols represent the experimental solubilities of GLZ, and the solid lines represent the solubilities of GLZ calculated by the Apelblat model.
