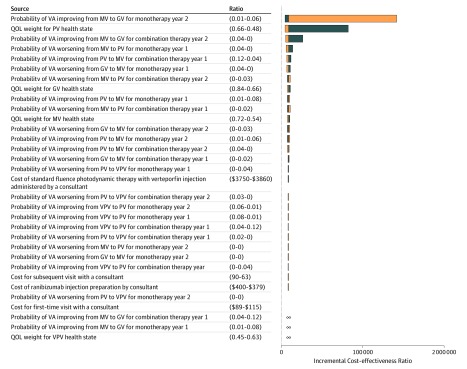
Figure 3. Tornado Diagram for 1-Way Sensitivity Analyses of Combination vs Monotherapy Therapy During a 10-Year Horizon.
Negative incremental cost-effectiveness ratios (ICERs) in the tornado diagram represent 1-way sensitivity analyses where combination therapy (intravitreal ranibizumab and verteporfin photodynamic therapy) dominates ranibizumab monotherapy (ie, combination therapy has higher quality-adjusted life-years [QALYs] and lower costs compared with monotherapy). For 3 parameters, the 1-way sensitivity analysis resulted in combination therapy being both more effective and more costly then monotherapy, but an ICER below the accepted threshold or combination therapy being dominated by monotherapy. These parameters are labeled with ∞. Additional details of the 1-way sensitivity analyses for these 3 parameters are also provided in eTable 6 in the Supplement. See the Overview subsection of the Methods section for definitions of the vision categories. Blue bars indicate results when using lower parameter value; orange bars, results when using upper parameter value. GV indicates good vision; MV, moderate vision; QOL, quality of life; PV, poor vision; VA, visual acuity; and VPV, very poor vision.

