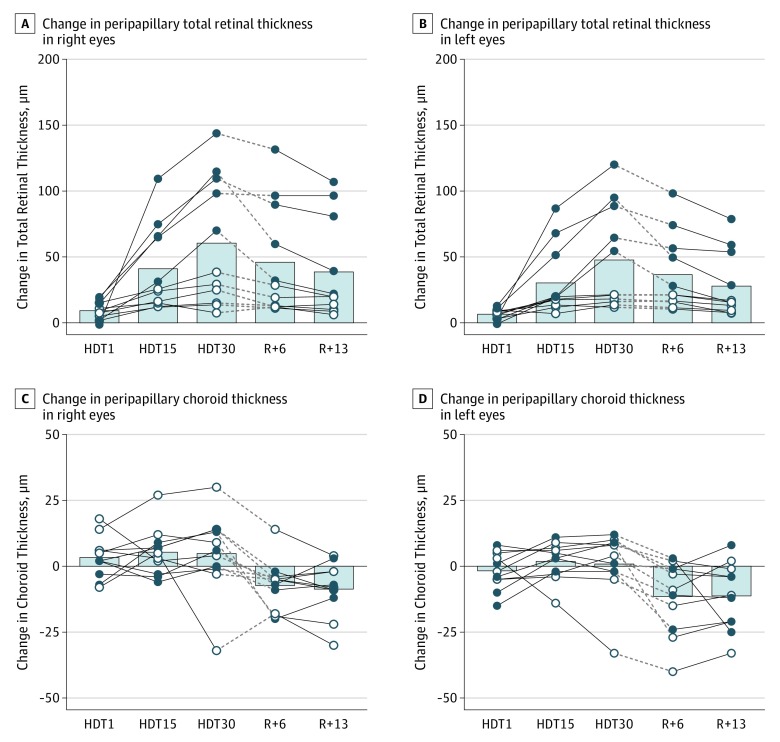
Figure 1. Change in Peripapillary Total Retinal Thickness and Peripapillary Choroid Thickness During and After 30 Days of Bed Rest in a Mildly Hypercapnic Environment.
A, Change in peripapillary total retinal thickness in the right eyes. B, Change in peripapillary total retinal thickness in the left eyes. C, Change in peripapillary choroid thickness in the right eyes. D, Change in peripapillary choroid thickness in the left eyes. All data from images collected in participants in the head-down tilt (HDT) (HDT day 1 [HDT1], HDT day 15 [HDT15], and HDT day 30 [HDT 30]) or horizontal (baseline, day 6 after bed rest [R+6], and day 13 after bed rest [R+13]) positions. The change in total retinal thickness associated with bed rest was significant at all days (marginal means: HDT1, 8.1 μm [95% CI, 4.4-11.8 μm]; P < .001; HDT15, 36.1 μm [95% CI, 14.2-58.0 μm], P < .001; HDT30, 53.9 μm [95% CI, 21.4-86.4 μm], P < .001; R+6, 41.2 μm [95% CI, 14.2-68.1 μm]; P < .001; R+13, 33.4 μm [95% CI, 9.8-56.9 μm]; P = .002). The association of bed rest with change in choroid thickness was not significant at any bed rest day (marginal means: HDT1, 0.7 μm [95% CI, −4.1 to 5.5 μm]; P > .99; HDT15, 3.6 μm [95% CI, −1.1 to 8.2 μm]; P = .22; HDT30, 2.7 μm [95% CI, −7.3 to 12.8 μm]; P > .99), but was significant during recovery after bed rest (marginal means: R+6, −9.5 μm [95% CI, −17.8 to −1.2 μm]; P = .02; R+13, −9.9 μm [95% CI, −18.2 to −1.6 μm]; P = .01). Columns represent the mean of all participants. Filled symbols represent individuals with diagnosis of optic disc edema from ophthalmoscopy images collected on HDT30. The dashed line indicates the break between bed rest when individuals were exposed to carbon dioxide, and post–bed rest recovery when they were not.

