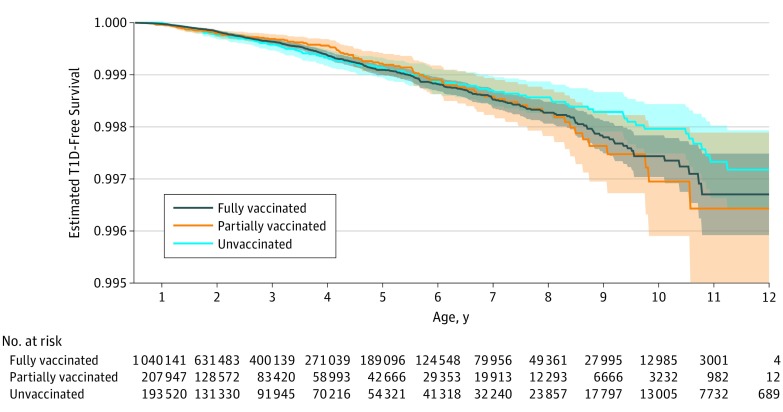
Figure. Unadjusted Type 1 Diabetes (T1D)–Free Survival Curve, by Rotavirus Vaccination Status.
Type 1 diabetes–free survival curve confidence intervals overlapped among children fully vaccinated (gray) compared with children partially vaccinated (orange) or unvaccinated (blue) against rotavirus. The plot is shown beginning at age 27 weeks, by which time all children will have been eligible to be fully vaccinated against rotavirus. Children who had not yet received any doses of diphtheria-tetanus-pertussis–containing vaccines are excluded, as were those receiving a T1D diagnosis or lost to follow-up before 27 weeks. Rotavirus vaccination status is treated as time varying. Data are from the IBM MarketScan Commercial Database (formerly known as the Truven Health MarketScan Commercial Claims and Encounters database), 2006 through 2017.

