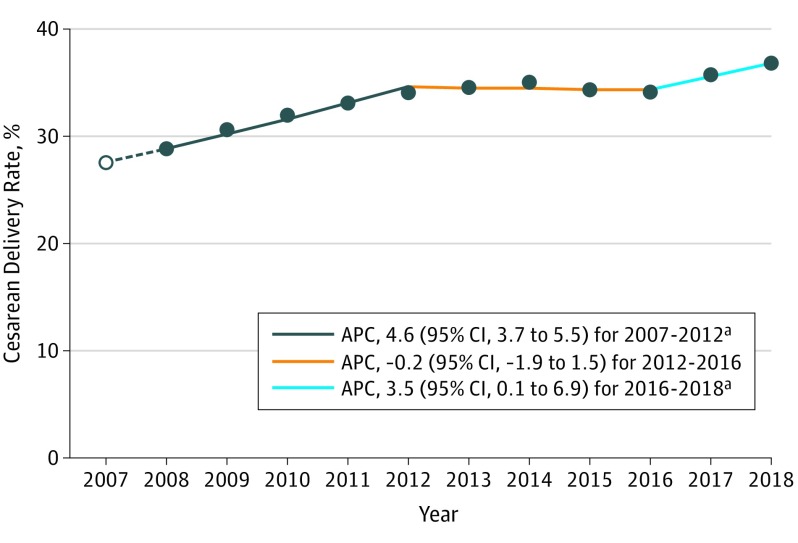
Figure 1. Trends in Cesarean Delivery Rates in China, 2008-2018.
The solid circles indicate annual cesarean delivery rates from China’s National Maternal and Child Health Statistics data set. The open circle indicates an estimate for 2007 based on linear extrapolation. Joinpoint regression was used to estimate the overall annual percentage change (APC) for 2008 to 2018 (1.8 [95% CI, 1.2-2.5]; P < .001). Joinpoint regression also identified 3 segments using the additional extrapolated point for 2007. The superimposed trend lines show the 3 segments identified by joinpoint regression.
aP < .05.

