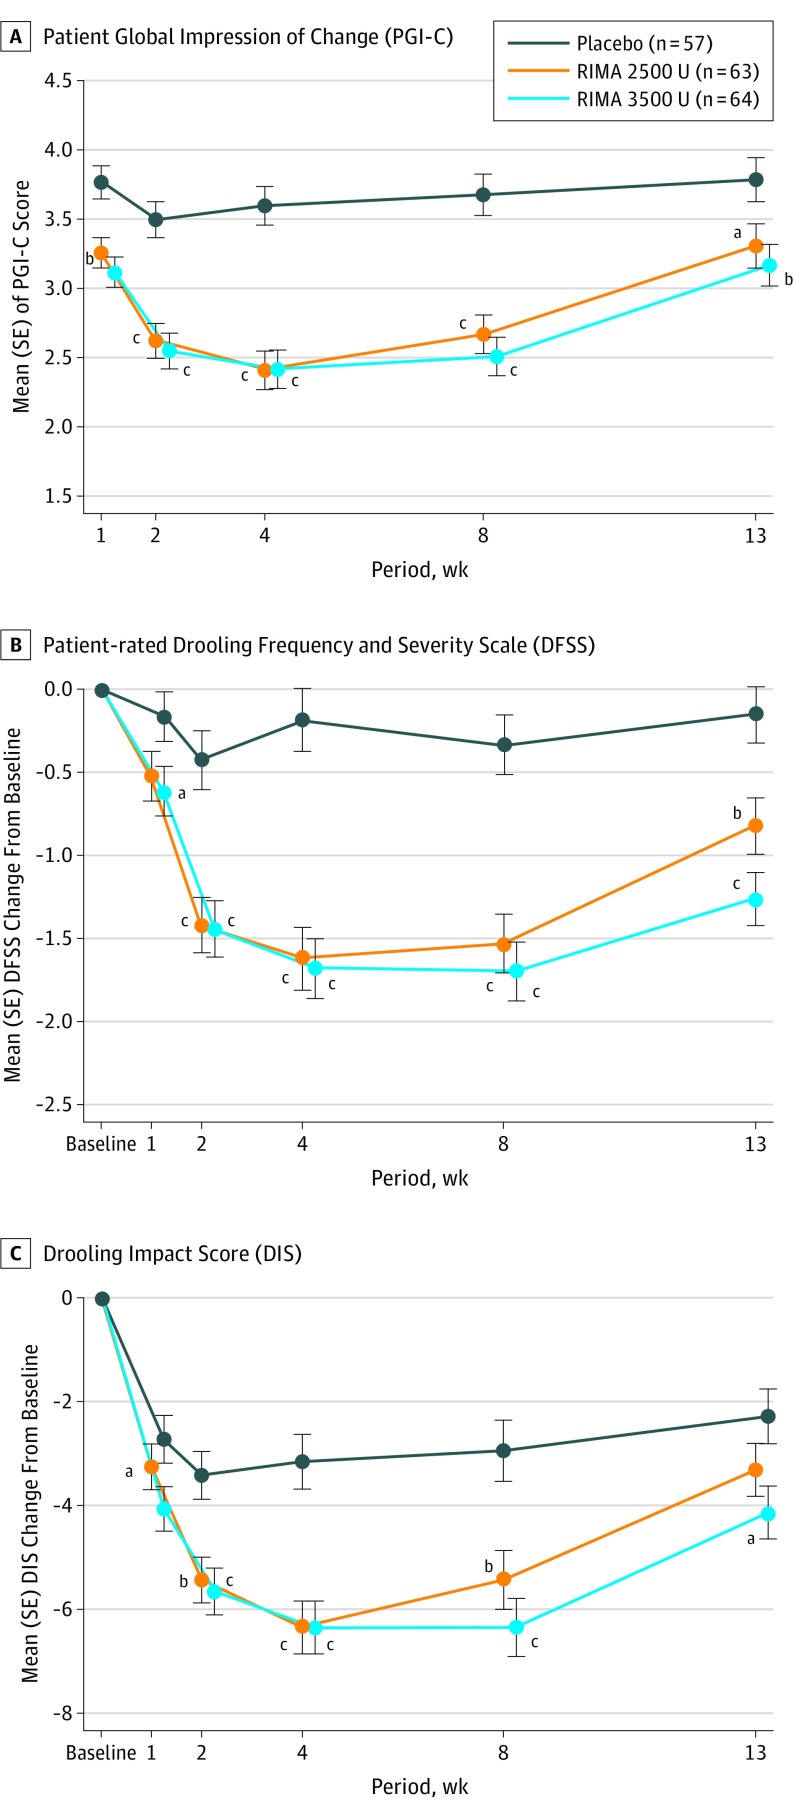
Figure 3. Secondary End Points: Changes From Baseline in Patient-Reported Outcomes.
Analysis of covariance model including dose group and site as factors and the corresponding baseline value as a covariate. RIMA indicates rimabotulinumtoxinB. Error bars indicate the SE.
aP < .05 vs placebo.
bP < .01 vs placebo.
cP < .001 vs placebo.

