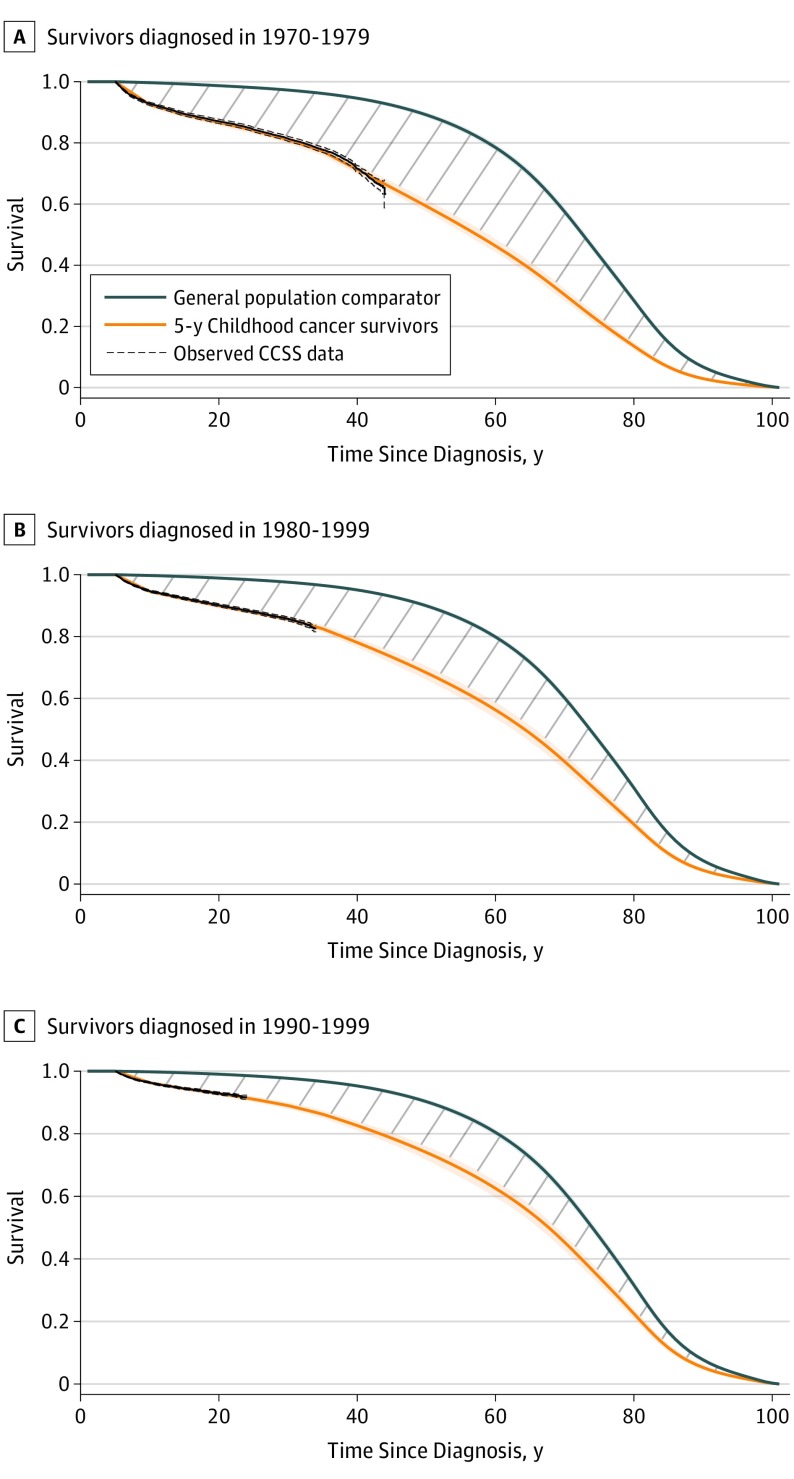
Figure 1. Projected Survival Curves for Childhood Cancer Survivors and General Population Comparators.
A, Survivors who received a childhood cancer diagnosis during the 1970-1979 treatment era. Life expectancy gap, 16.5 years (95% uncertainty interval [UI], 15.5-17.5 years). B, Survivors who received a childhood cancer diagnosis during the 1980-1989 treatment era. Life expectancy gap, 12.3 years (95% UI, 11.3-13.4 years). C, Survivors who received a childhood cancer diagnosis during the 1990-1999 treatment era. Life expectancy gap, 9.2 years (95% UI, 8.3-10.4 years). Shaded regions indicate the 95% UIs. The areas under the curves represent the projected life expectancy for the general population comparator and 5-year survivors. The area between the curves, as indicated by the diagonal gray lines, represents the gap in life expectancy between the 5-year cancer survivors and the general population comparator. Observed data from the Childhood Cancer Survivor Study (CCSS) are shown by the dashed lines.

