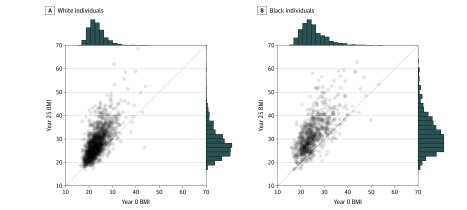
Figure 1. Distribution of Body Mass Index (BMI) Over 25 Years in the Coronary Artery Risk Development in Young Adults (CARDIA) Study.
A and B, The data represent individuals who had BMI data at study entry (year 0) and in follow-up (year 25). The marginal histograms show the distribution of BMI at each time point. Points above the dashed line represent individuals whose BMI increased from baseline to year 25. BMI is calculated as weight in kilograms divided by height in meters squared.

