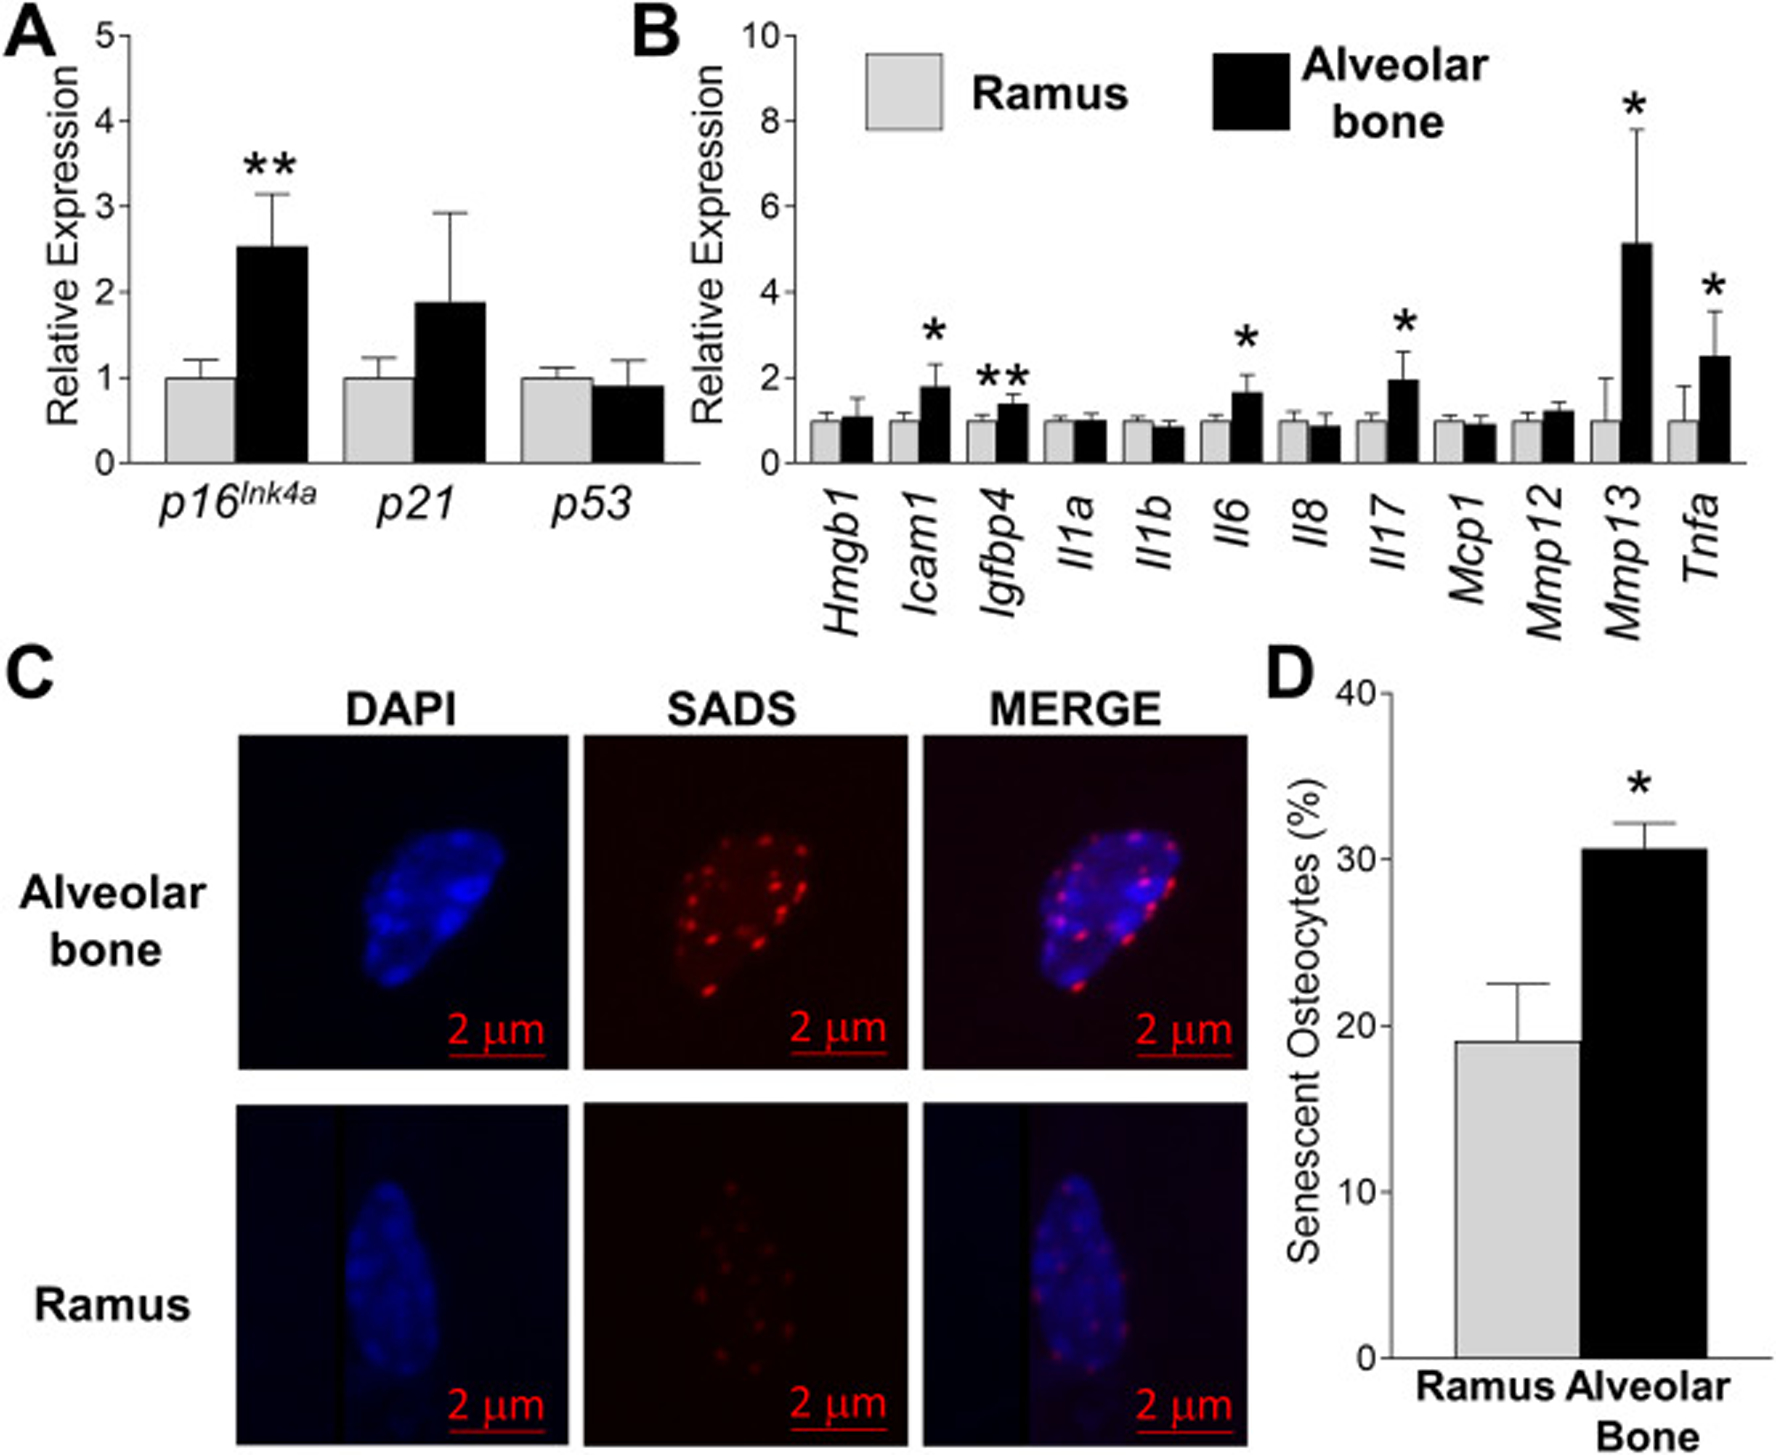
Fig. 1.

Identification of senescent cells in young alveolar bone. (a-b) Alveolar bone and ramus osteocyte-enriched cell populations were prepared from 6 month-old WT female mice and immediately assayed (no culture) for expression of selected senescent marker and SASP genes using QPCR. Data represent Mean ± SEM (n=10). *P ≤ 0.05 and **P≤ 0.01 relative to ramus control. (c) Fluorescent in situ hybridization (FISH) was used to identify SADS-positive senescent cells in ramus and alveolar bone from 6 month-old WT female mice in vivo (a representative cell is shown). (d) Quantitation of SADS-positive cells in ramus and alveolar osteocyte-enriched cell populations (50 cells counted per sample). The red bar denotes the magnification scale (2 μm). Data represent Mean ± SEM (n=10). *P ≤ 0.05 relative to ramus control.
