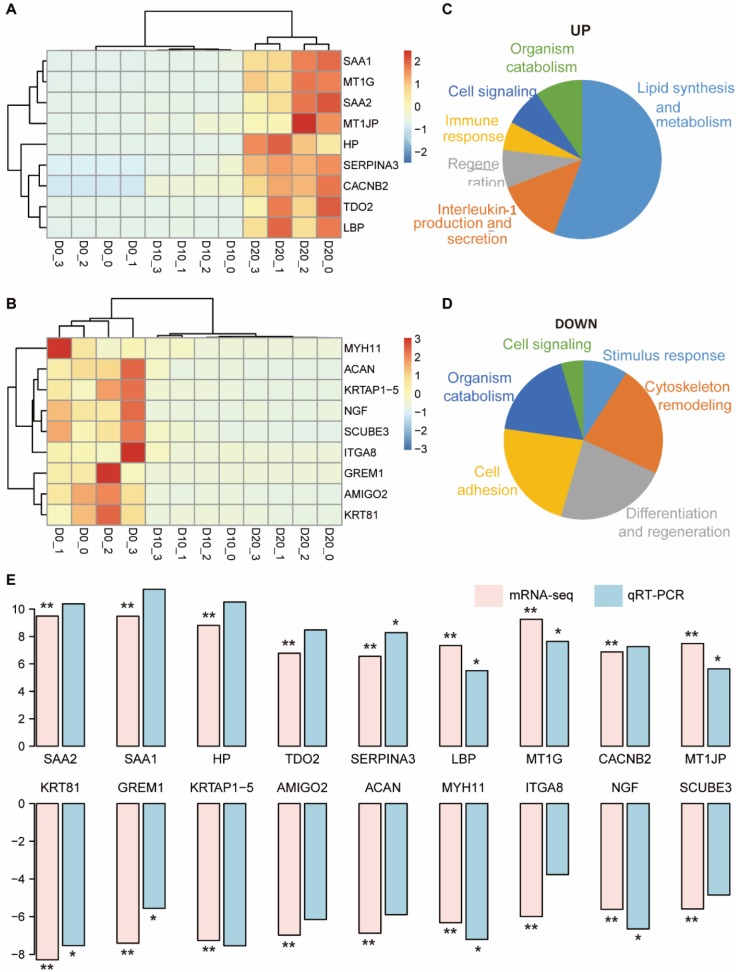
Figure 4.
Functional annotation of 18 representative DEGs and validation via qRT-PCR. (A, B) The clustering results of the top 9 upregulated (A) and 9 downregulated (B) DEGs. (C, D) Biological processes related to the upregulated (C) and downregulated (D) DEGs. (E) Comparison of the log2 fold changes of the 18 DEGs in mRNA-seq analysis and qRT-PCR validation. The significance levels were compared between D20 and D0; * indicates P-value < 0.05, ** indicates P-value < 0.01.

