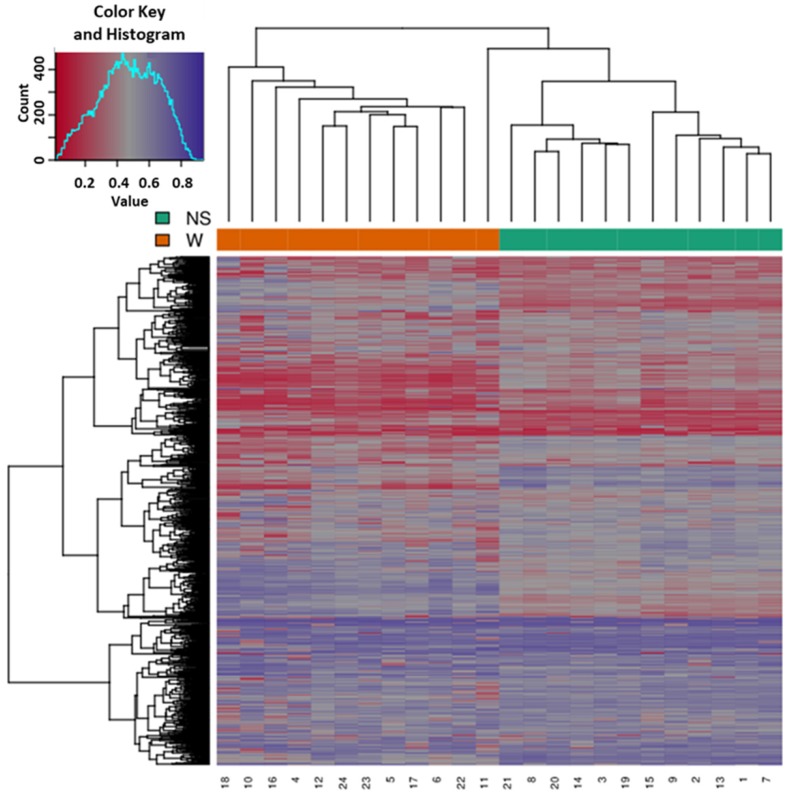
Figure 3.
Heatmap showing the hierarchical clustering of samples displaying only the top-ranking 1000 most variable promoters with the highest variance across all samples. Clustering utilized complete linkage and Manhattan distance. The top x-axis shows the normal skin (NS) and wart (W) samples, while the bottom x-axis shows the patient identification number. Values of 0 (red color) and 1 (purple color) indicate decreased and increased methylation, respectively.

