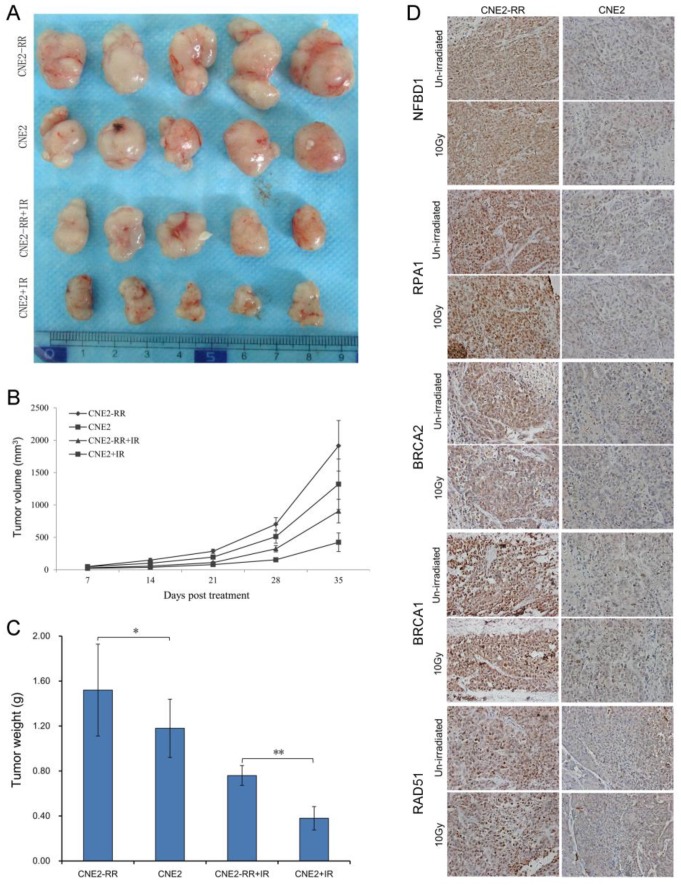
Figure 6.
Validation of key pathway proteins from the HRR pathway in xenograft tumors. (A) Representative images of the tumors from mice 35 days after treatments. (B) The growth curves of CNE2 and CNE2-RR cells xenografts with radiation or non-radiation treatment. (C) Tumor weight at 35 days after treatments, n = 5 mice per condition. *P<0.05, **P<0.01. (D) The representative results of NFBD1, BRCA1, BRCA2, RPA1 and RAD51 in CNE2 and CNE2-RR cells xenograft tumors with radiation or non-radiation treatment by immunohistochemistry. *P<0.05 and **P<0.01.

