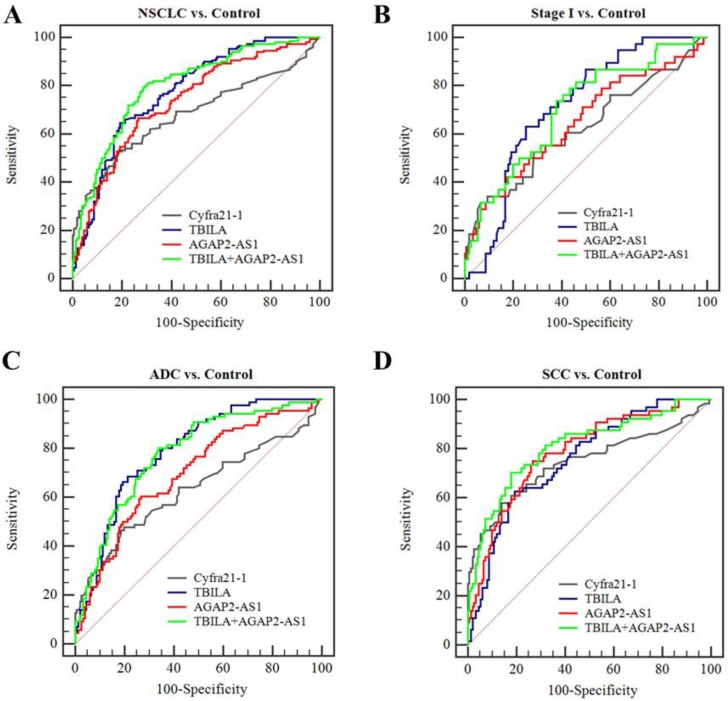
Figure 5.
Diagnostic efficiency of individual or combined exosomal lncRNAs for NSCLC. (A-B) ROC curve analysis for exosomal lncRNAs in distinguishing NSCLCs overall or stage I NSCLC patients versus healthy controls. (C-D) ROC curve analysis for exosomal lncRNAs for ADC patients or SCC patients versus healthy controls.

