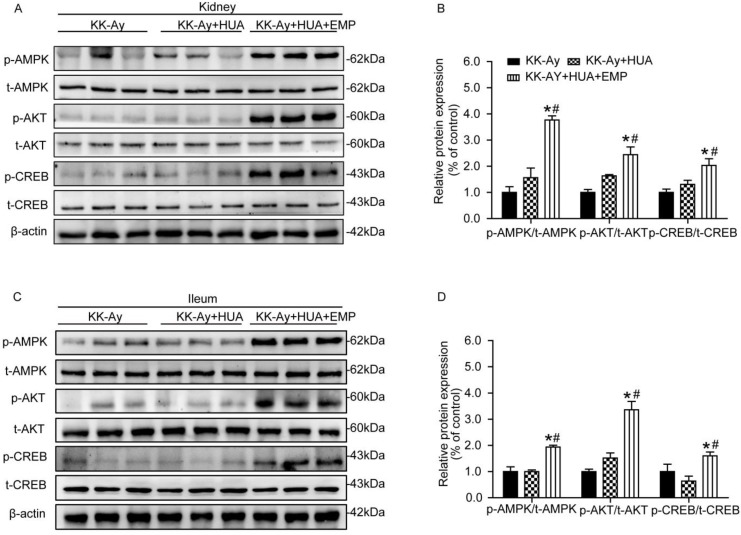
Figure 4.
Effects of empagliflozin on AMPK/AKT/CREB/ signaling in kidney and ileum from KK-Ay mice with hyperuricemia. (A-B) Western blot and its analysis of p-AMPK, p-AKT and p-CREB in kidney. Levels of p-AMPK, p-AKT and p-CREB were obviously increased in KK-Ay+HUA+EMP group in kidney. (C-D) Western blot analysis of p-AMPK, p-AKT and p-CREB in ileum. Levels of p-AMPK, p-AKT and p-CREB were obviously increased in KK-Ay+HUA+EMP group in ileum. One-way ANOVA followed by Tukey's test was applied to compare the differences between any two of three groups. The data are presented as the mean ± SEM (n = 5 for each group). *P < 0.05 vs. KK-Ay group; #P < 0.05 vs. KK-Ay+HUA group. KK-Ay, non-treated KK-Ay mice as control; KK-Ay+HUA, non-treated KK-Ay mice with hyperuricemia induced by combination of peritoneal injection of potassium oxonate at dose of 250mg/kg and intragastric administration of hypoxanthine at dose of 300mg/kg; KK-Ay+HUA+EMP, empagliflozin-treated KK-Ay mice with hyperuricemia induced by combination of peritoneal injection of potassium oxonate at dose of 250mg/kg and intragastric administration of hypoxanthine at dose of 300mg/kg.

