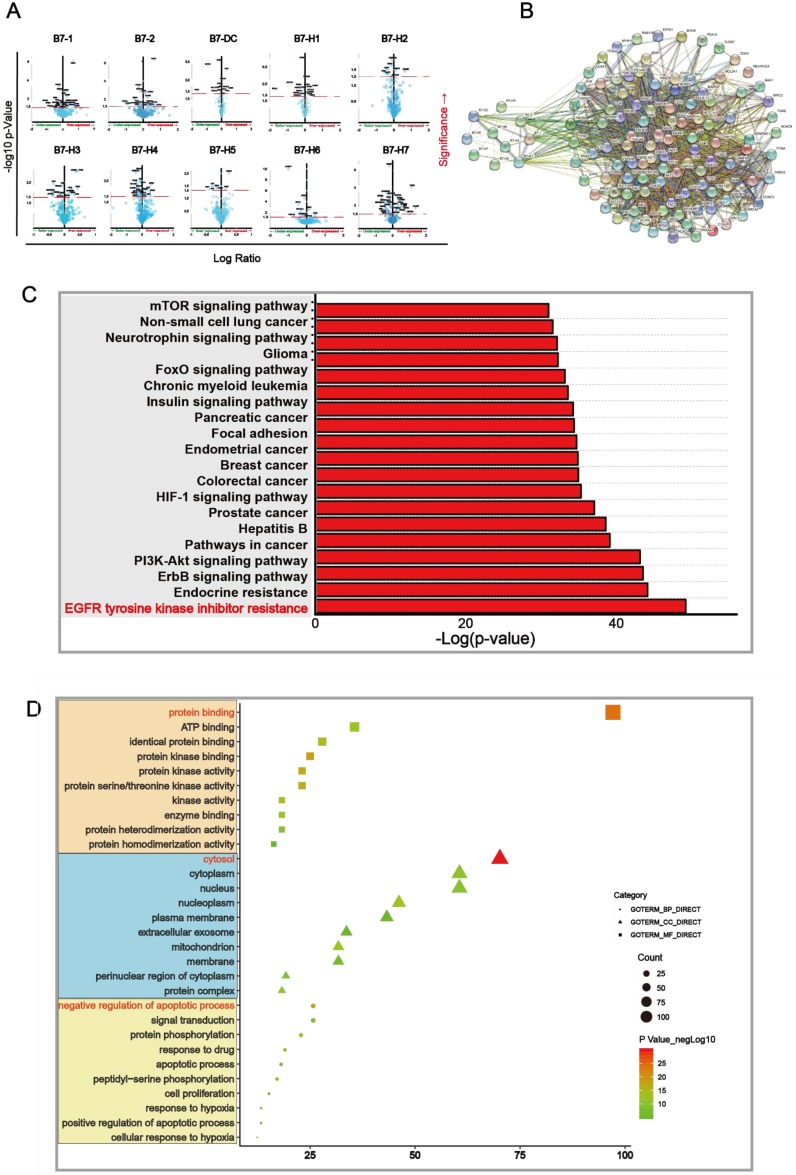
Figure 4.
Main signaling pathway affected by B7 family members. A. Volcano plot was drawn to identify differential proteins affected by B7 members analyzed using Reverse Phase Protein Arrays (RPPA) in cBioPortal. The Y axis is the value of fold change of expression level is based on logarithmic ratio (mean of changed expression/mean of unchanged expression). -log10 (p-value)>1.30 is considered to be a significant difference. B. Multicenter protein-protein interaction (PPI) network analysis between B7 family member and differential proteins in STRING database. The stronger the interaction between the two proteins, the thicker the lines. C. Prediction of downstream pathways related to B7 family genes alterations was analyzed by KEGG pathway analysis via DAVID. D. Bubble chart of the GO (Gene Ontology) enrichment analysis of the B7 family was analyzed via DAVID. Gene count and P values were considered to obtain important metabolic process.

