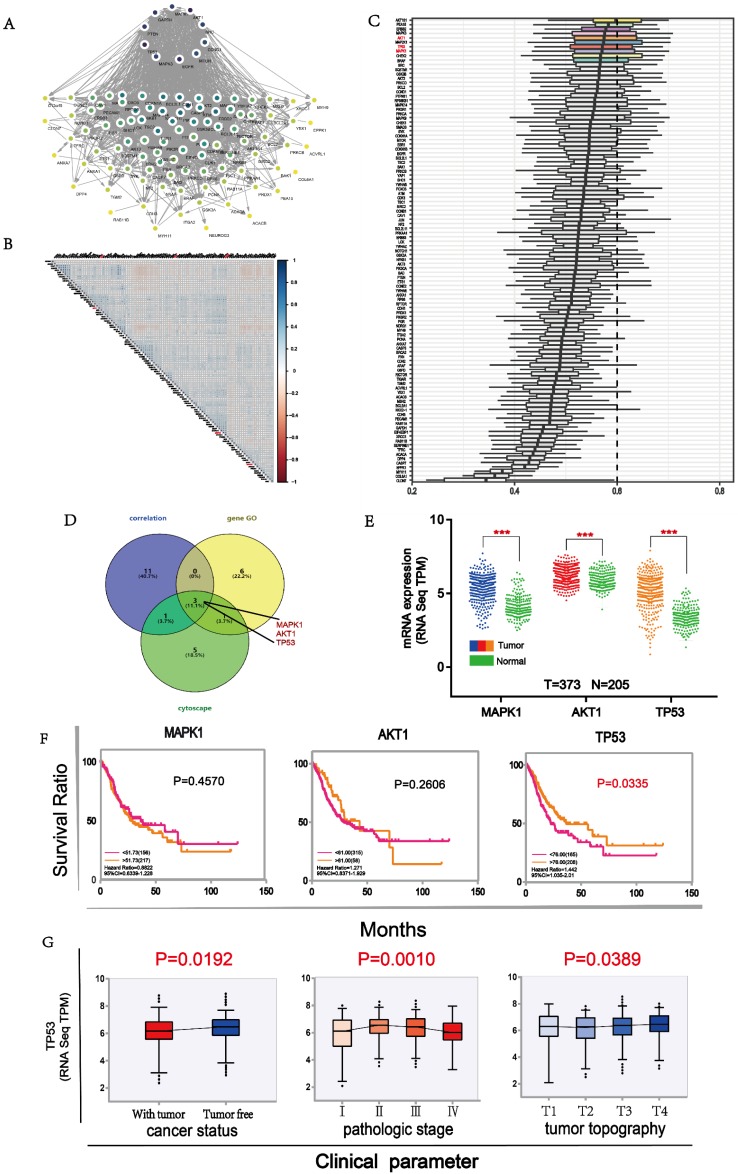
Figure 5.
Main targets of B7 members. A. The protein interaction network diagram of differential proteins by cytoscape. Ten proteins in black color were strongly connected to other proteins. B. Co-expression analysis of B7 differential proteins. The color intensity reflects the reliability of co-expression. C. GO analysis of differential proteins. Ten proteins were shown to be important in biological processes, cell components, and molecular functions. D. Venn diagram was used to screen important downstream proteins by 3 methods. MAPK1, AKT1, TP53 were predicted to be major downstream targets. E. The comparison of expression level of MAPK1, AKT1 and TP53 between tumor and normal samples. F. Survival analysis of MAPK1, AKT1 and TP53 in gastric cancer. G. Clinical parameters analysis of TP53 in gastric cancer.

