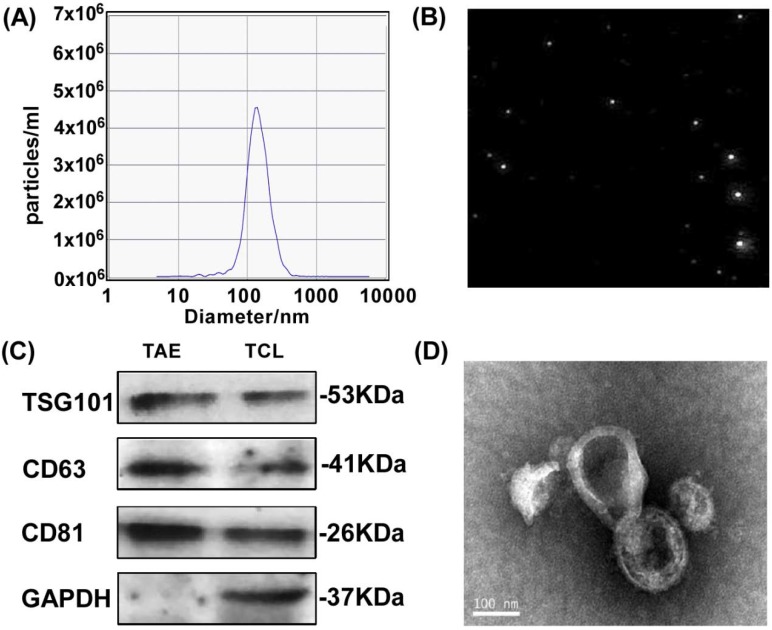
Figure 1.
Characterization and surface protein of A549 TAEs. (A-B) The particle size measurement of exosomes. (C) Western blot analysis for detecting the expression of exosomal biomarkers and cellular protein in A549 TAEs. Total protein (20 μg) was loaded for A549 cell lysates and TAEs. (D) Transmission electron microscopic image of A549 TAEs (arrowheads, scale bar = 100 nm). Experiments were repeated three times in triplicate each time (n = 3).

