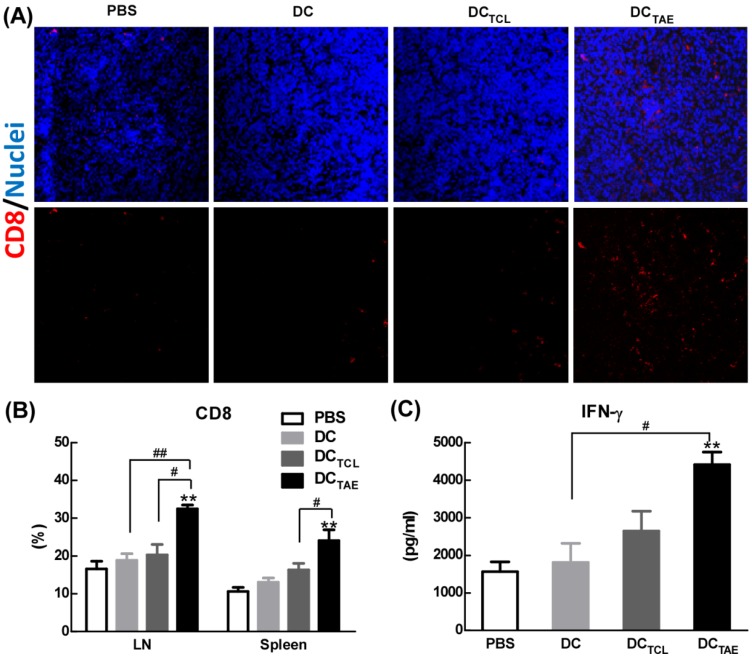
Figure 5.
The effect of cancer vaccines on CD8+ T cells in tumor bearing mice. C57BL/6 tumor bearing mice were established as described in Fig. 4, and i.v. injected with different vaccines on day 7, 14, and 21 post tumor inoculation. One day after 3rd injection, tumors were dissected and then snap frozen. Frozen section of tumor tissues were labeled with PE-anti-mouse CD8 (A) as described in Section 2, and immunofluorescence images were recorded using a confocal microscopy. Splenocytes and TDLNs were isolated and labeled with PE-anti-mouse CD8, and the percentages of CD8+ T cells (B) in total splenocytes were measured using flow cytometry. Some splenocytes were re-stimulated with LLC TCLs in vitro, and the productions of IFN-γ were measured using ELISA (C). Images shown represent the data from 5 mice/group. Bars shown are mean ± SE (n = 4-5), and the differences among groups were analyzed using one-way ANOVA analysis followed by Tukey's post test. **: p < 0.01. # Differences between two different groups are statistically different, #: p < 0.05; ##: p < 0.01.

