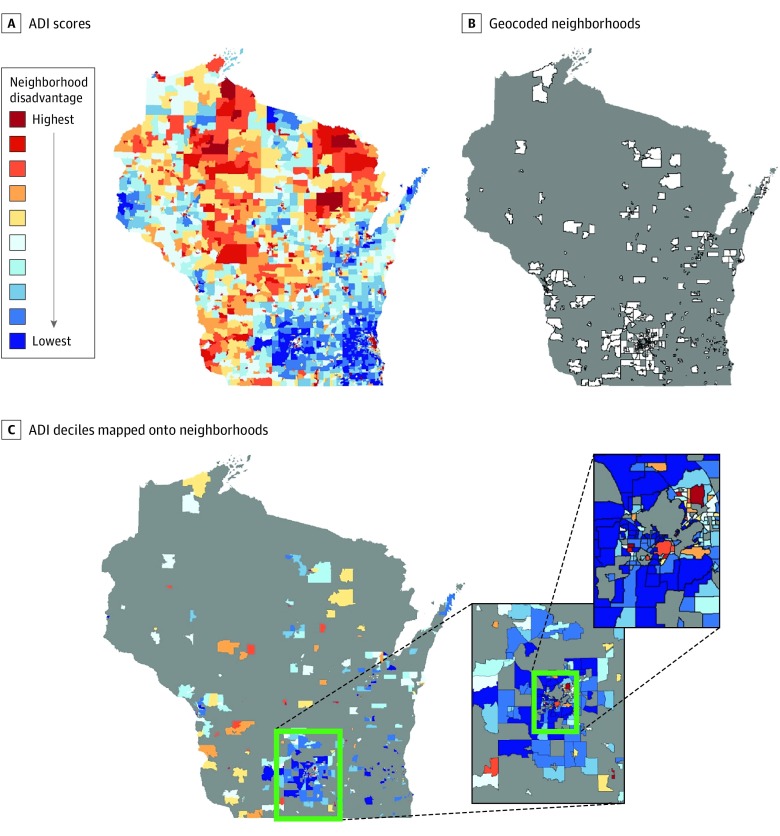
Figure 1. Mapping Neighborhood Socioeconomic Disadvantage Onto the Study Population.
A, Area disadvantage (ADI) scores are calculated for every census block group in each state and converted to relative deciles based on statewide norms. The state of Wisconsin is shown as an illustrative example. B, Study population residential zip codes +4 (neighborhoods) are geocoded and mapped to nearest block group. C, ADI deciles from matching block groups are mapped onto participant neighborhood. Pop-out highlights the increased density of block groups characteristic of urban areas. Gray areas indicate no study participants residing in corresponding block group.

