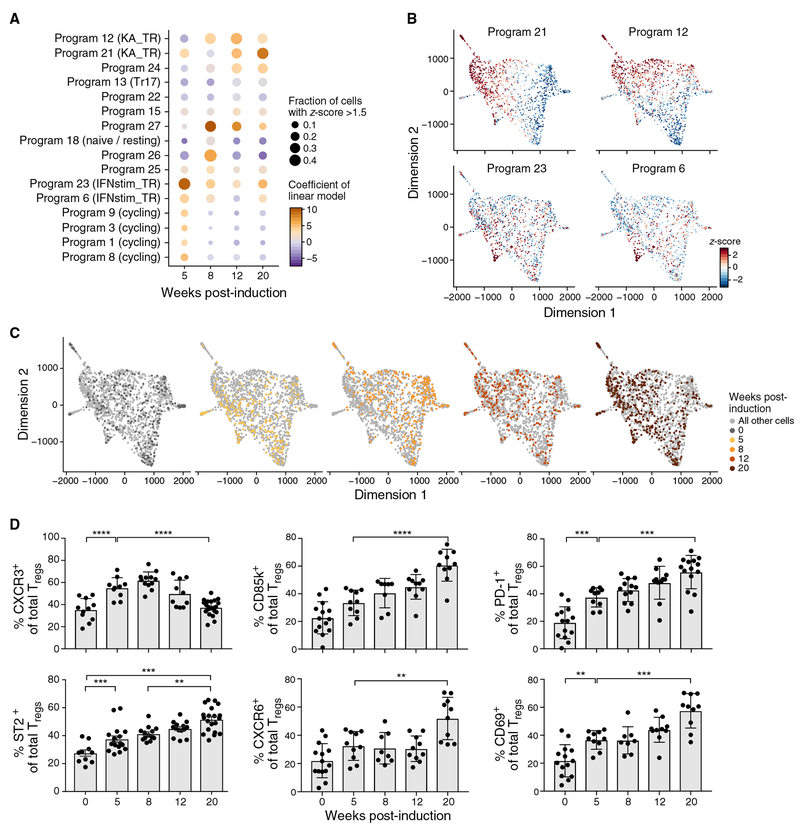
Figure 2. A Klrg1+Areg+ Treg Phenotype Becomes Dominant during Tumor Development.
(A) Changes in prominence of cycling, IFN-stimulated, and Treg effector-like programs with tumor development. Linear regression analysis of program expression Z scores as a function of time since tumor initiation. Dot plot shows for each program (row) and time point (column) the coefficient of the time point covariate (color scale) with non-tumor-bearing lung as reference and the percentage of cells with Z score > 1.5 (dot size).
(B and C) An IFN and a Klrg1+Areg+ effector-like program peak early and late in tumor development, respectively. Two-dimensional force-directed layout embedding of lung Tregs colored by normalized program Z score for the KA_TR program (B, top, programs 12 and 21), IFNstim_TR program (B, bottom, programs 6 and 23), and time point (C).
(D) Percentage of Tregs expressing the indicated protein (y axis) throughout KP tumor development (x axis) from two to three experiments (dot: one mouse). Error bars: SEM. **p < 0.01, ***p < 0.001, ****p < 0.0001, Tukey’s multiple comparisons test.

