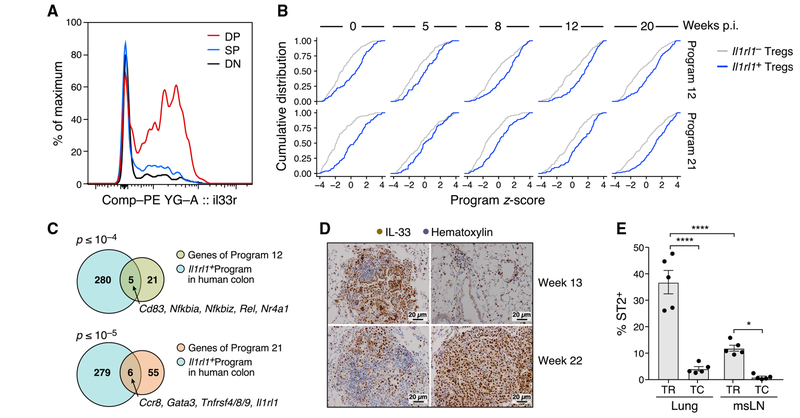
Figure 3. ST2 Marks a Diverse Population of KA/DP Tregs in Lung Tumor-Bearing Mice.
(A) ST2 is most highly expressed in DP lung Tregs. Representative distributions of ST2 expression on CD103−KLRG1− (DN, gray), CD103+KLRG1− (SP, blue), and CD103+KLRG1+ (DP, red) Tregs isolated from tumor-bearing lungs.
(B) KA_TR genes are upregulated in Il1rl1+ Tregs throughout tumor development. Empirical cumulative distribution functions (ECDFs) of the scores of programs 12 (top) and 21 (bottom) of Il1rl1+ (blue) versus Il1rl1− Tregs (gray) by time point after tumor induction.
(C) Il1rl1+ Tregs in human colon cancer have higher expression of KA_TR genes. Overlap of genes upregulated in I11rl1+ Tregs in human colon cancer (blue) and programs 12 (top, p = 1.5 × 10⁻⁵) and 21 (bottom, p = 5.3 × 10⁻⁶) genes (STAR Methods). p values: hypergeometric test.
(D) IL-33 is highly expressed in lung adenocarcinoma. Immunohistochemistry (IHC) staining of tumor-bearing lungs from KP mice at weeks 13 and 22 p.i. with Lenti-LucOS. Two representative images are shown per time point. Scale bar: 20μm.
(E) Lung Tregs are enriched for ST2+ cells in late-stage tumors. Percent ST2+ among lung and msLN Tregs and Tconvs from tumor-bearing KP mice at week 20 p.i. as measured by flow cytometry. Error bars: SEM. ****p < 0.0001, *p < 0.05, Tukey’s multiple comparisons test.

