
Fig. 1. High sensitivity optical biodetection using frequency locked microresonators.
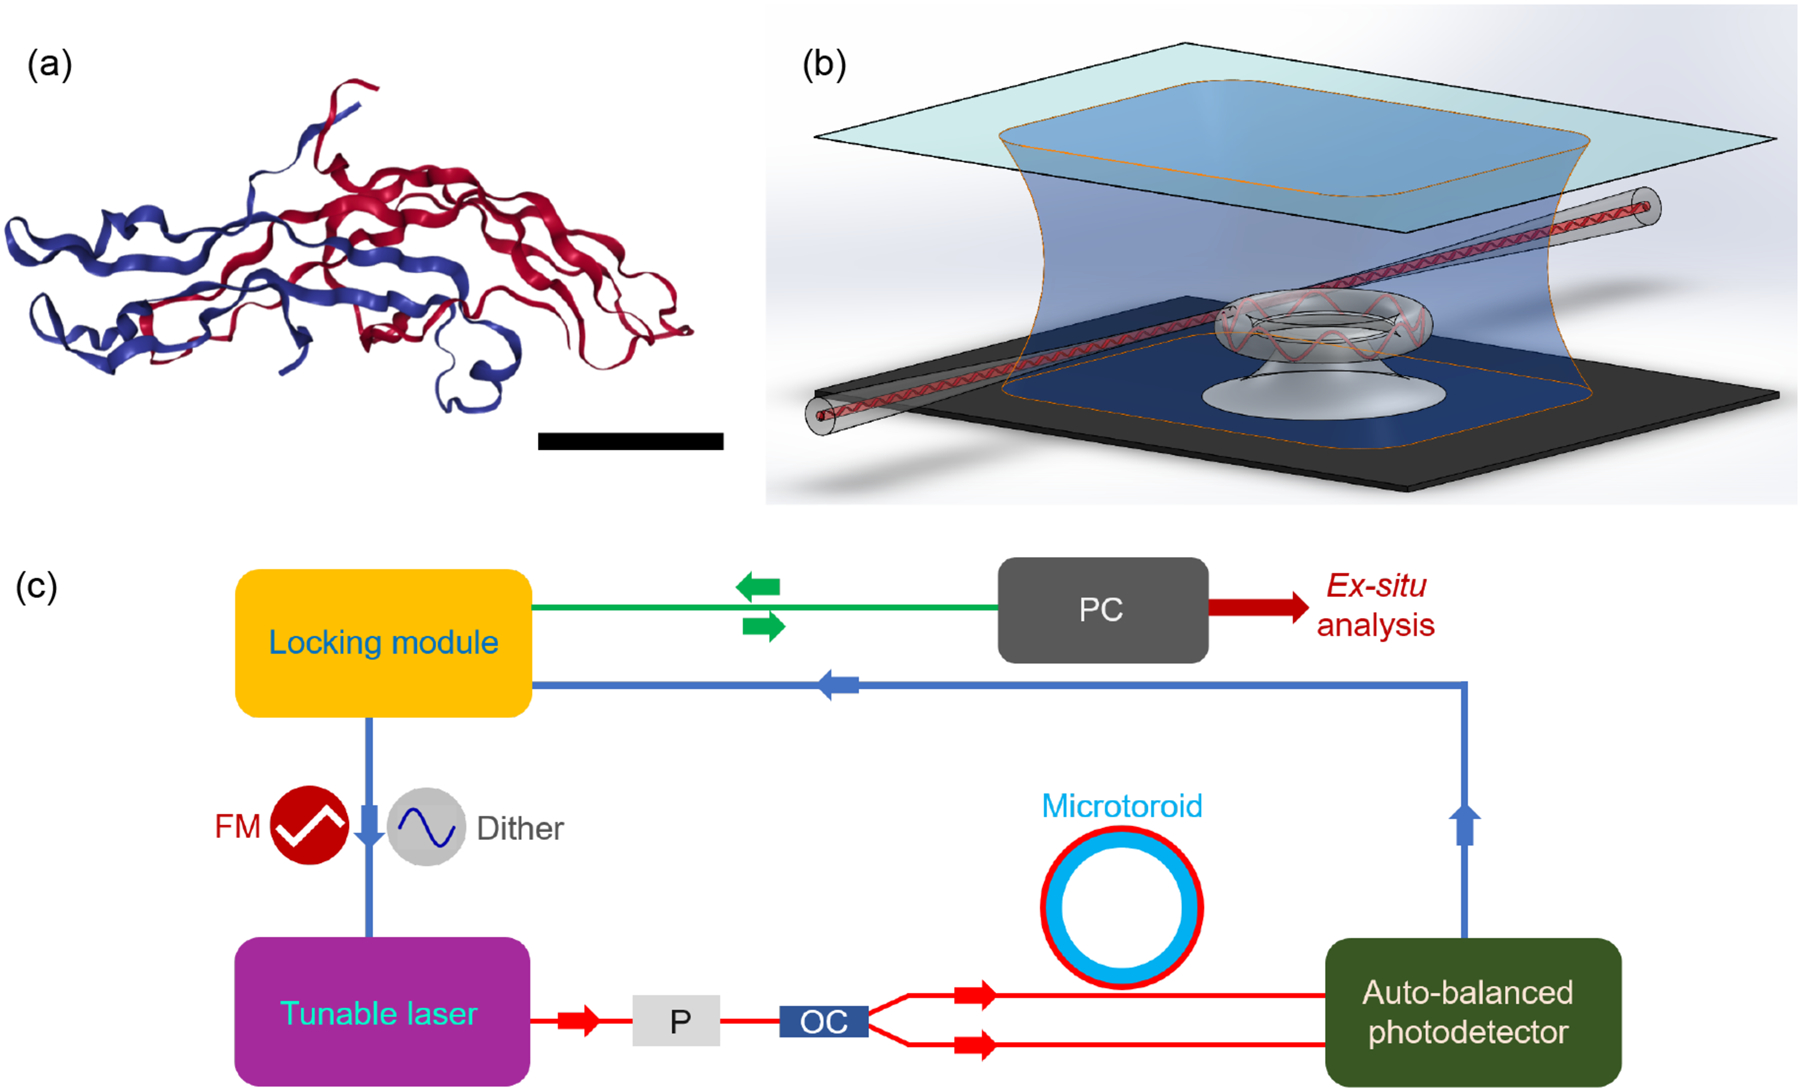
(a) 3D structure of hCG, which is a 37.5 kDa protein, consisting of two subunits, α (blue) and β (red). The scale bar is 2 nm. (Image from the RCSB PDB (www.rcsb.org) of PDB ID 1HRP (Lapthorn, A.J., Harris, D.C., Littlejohn, A., Lustbader, J.W., Canfield, R.E., Machin, K.J., Morgan, F.J., Isaacs, N.W.) (1994) Crystal structure of human chorionic gonadotropin, Nature 369: 455–461) (b) Schematic of microtoroid resonator inside sample chamber. Light is evanescently coupled into a microtoroid using a tapered optical fiber. Analyte-containing solutions are flowed over the microtoroid sensor using a syringe pump. Binding of analyte molecules to the microtoroid’s surface causes changes in its resonance frequency. (c) Block diagram of FLOWER. Resonance frequencies of the microtoroid are first found by applying a 100 Hz triangular waveform voltage signal to the frequency modulation (FM) input port of the laser. Frequency locking experiments are performed by applying a 2 kHz sinusoidal dither signal which generates an error signal. A proportional-integral-derivative (PID) controller enables tracking of the resonance wavelength changes of the microtoroid as particles bind. P= polarizer and OC = 1 × 2 optical coupler. Data is recorded using a 24-bit analog to digital converter. Analysis is performed after data acquisition.