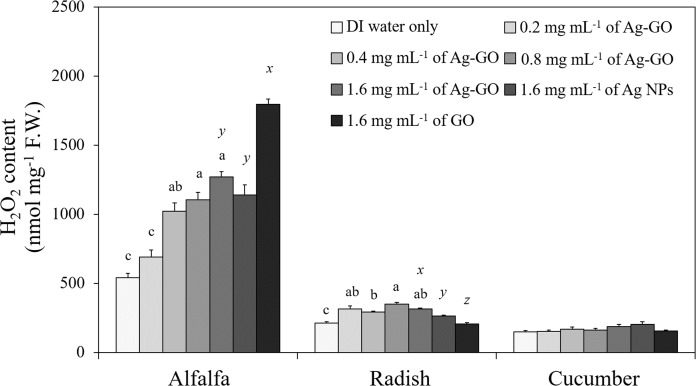
Figure 3. Effects of Ag-GO on the accumulation of H2O2 in alfalfa, radish and cucumber seedlings at day 7.
Means followed by the same letter are not significantly different at α = 0.05. Letters a, b and c indicate a significant difference among Ag-GO treatments at different concentrations, and x, y and z indicate that among 1.6 mg mL−1 of Ag-GO, Ag NP and GO treatments. Error bars represent one standard error (n = 4).

