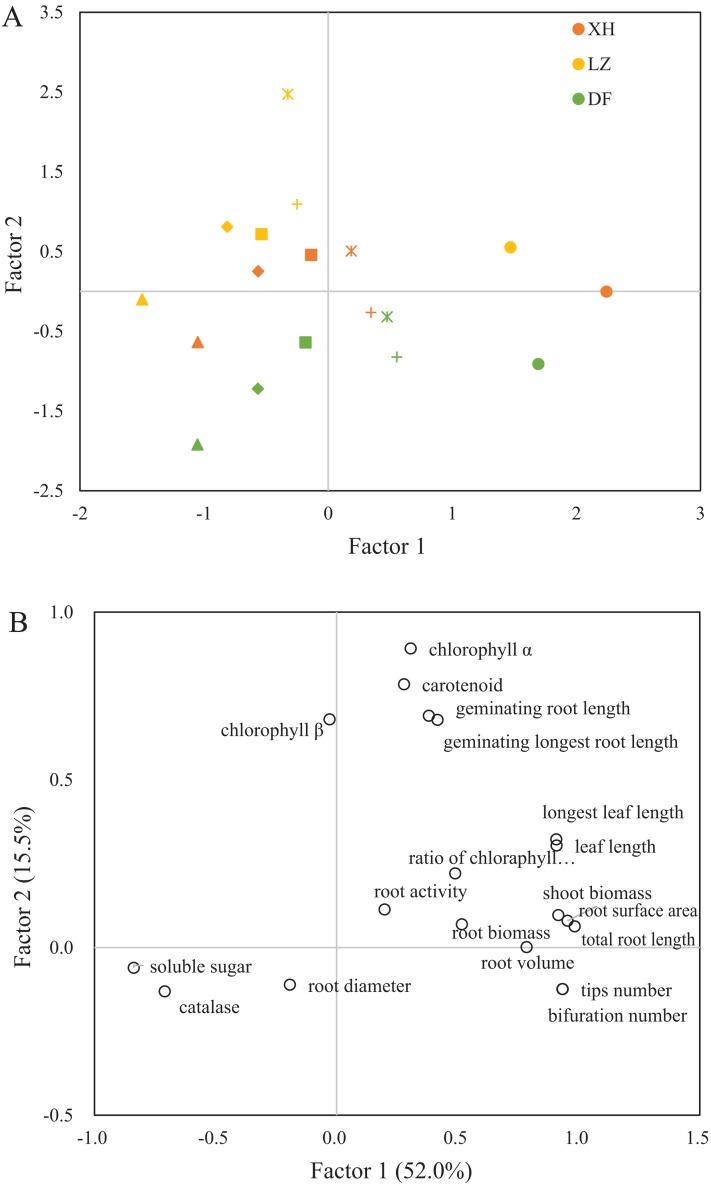
Figure 2. The principle component analysis of the tested physiological growth parameters for three wheat cultivars.
(A) The loading scores of the tested samples on the principle components. Different Cd treatments were represented by ⚫ (control), + (2.5 mg·L−1),  (5 mg·L−1), ◼ (10 mg·L−1), ♦ (20 mg·L−1) and ▴ (40 mg·L−1) and (B) the component matrix of the tested factor, each component explained 52.0% and 15.5% of the total variance.

