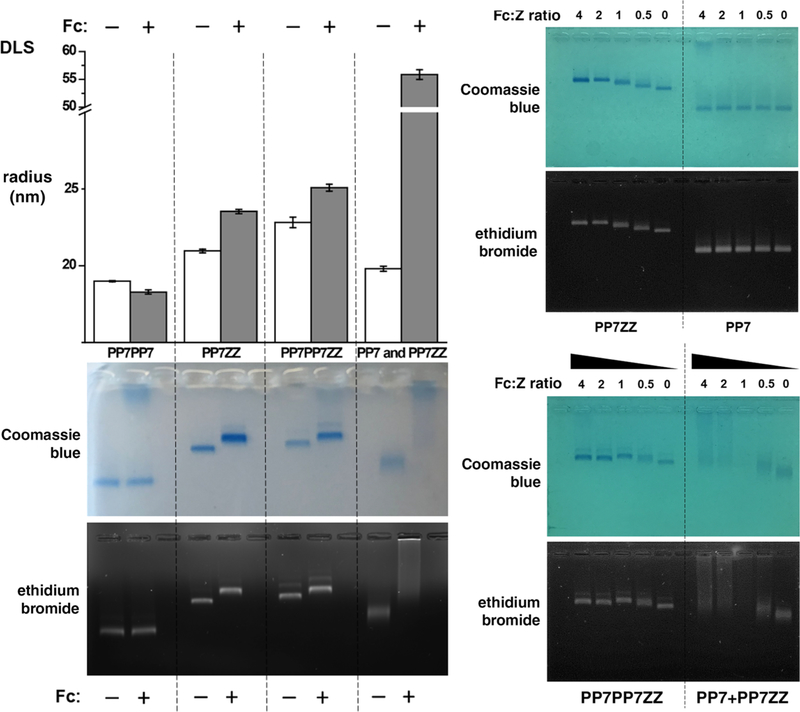
Figure 2.
(top left) Hydrodynamic radii of the indicated particles in the presence and absence of excess Fc domain. (bottom left) Native agarose gel electrophoresis of the same mixtures. (right) Native agarose gel electrophoresis of the indicated particles (0.1 mg/mL) with decreasing concentrations of Fc domains, relative to the displayed Z- or ZZ-domains.

