. 2019 Jul 26;8(6):833–841. doi: 10.1039/c9tx00080a

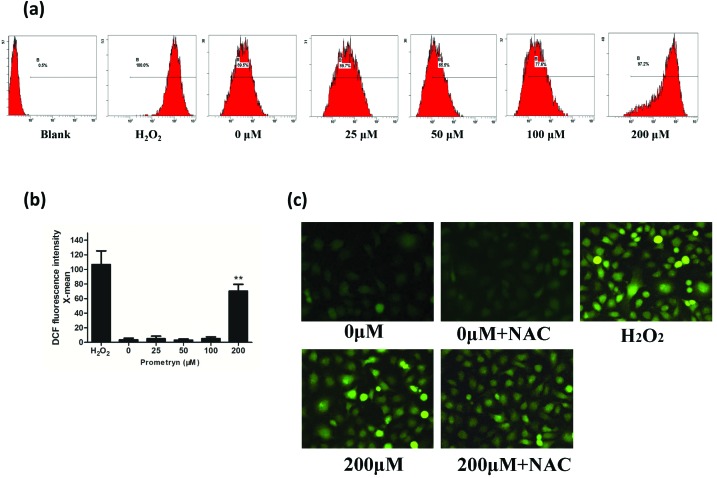
Fig. 4. Intracellular ROS generation induced by prometryn in BEAS-2B cells. Flow cytometry was used to determine intracellular ROS levels in BEAS-2B cells after 48 h of treatment with different concentrations of prometryn (0, 25, 50, 100, and 200 μM). Untreated cells were used as a negative control, and cells treated with 1 mM H2O2 were used as a positive control (a). The mean fluorescence intensity (MFI) was measured by flow cytometry. Results are presented as MFI ± SEM (n ≥ 3). The data were analyzed for statistical significance using Student's t test (*P < 0.05, ** P < 0.01) (b). Cells were treated with prometryn at the indicated concentrations in the presence or absence of 5 mM NAC. The solvent alone (0.1% DMSO) with or without NAC was used as negative controls, and H2O2 was used as a positive control. After 48 h, cells were stained with 10 μM DCFH-DA for 20 min and then viewed with an inverted fluorescence microscope (original magnification, ×400) (c).

Fig. 4