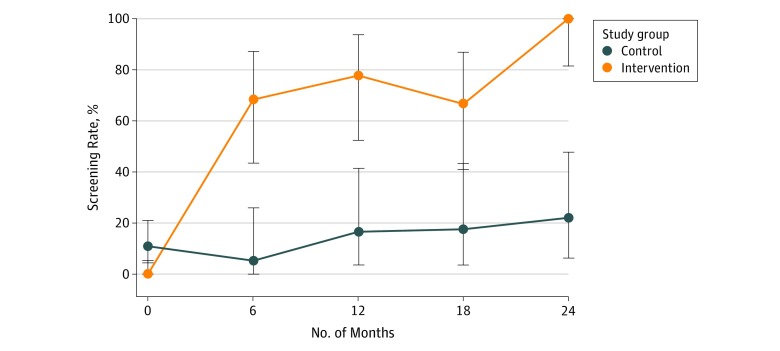
Figure 2. Run Chart Showing the Rates of Autism Spectrum Disorder Screening in Eligible Children During the Study Period.
The screening rate at each time point for each group was estimated using the binomial distribution, and the 95% CIs (error bars) were from Clopper-Pearson (exact)–type intervals.

