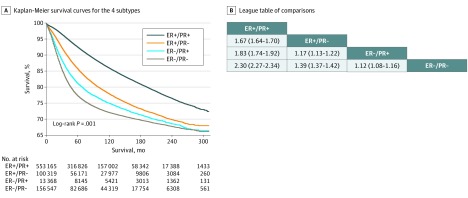
Figure 3. Breast Cancer–Specific Survival of Patients Stratified by Estrogen Receptor (ER) Status and Progesterone Receptor (PR) Status.
A, Kaplan-Meier survival curves show breast cancer–specific survival rates. B, Data are presented as hazard ratios (95% CIs). A hazard ratio exceeding 1 favors the column-defining subtype.

